The Loudness Measurements
Momentary Loudness
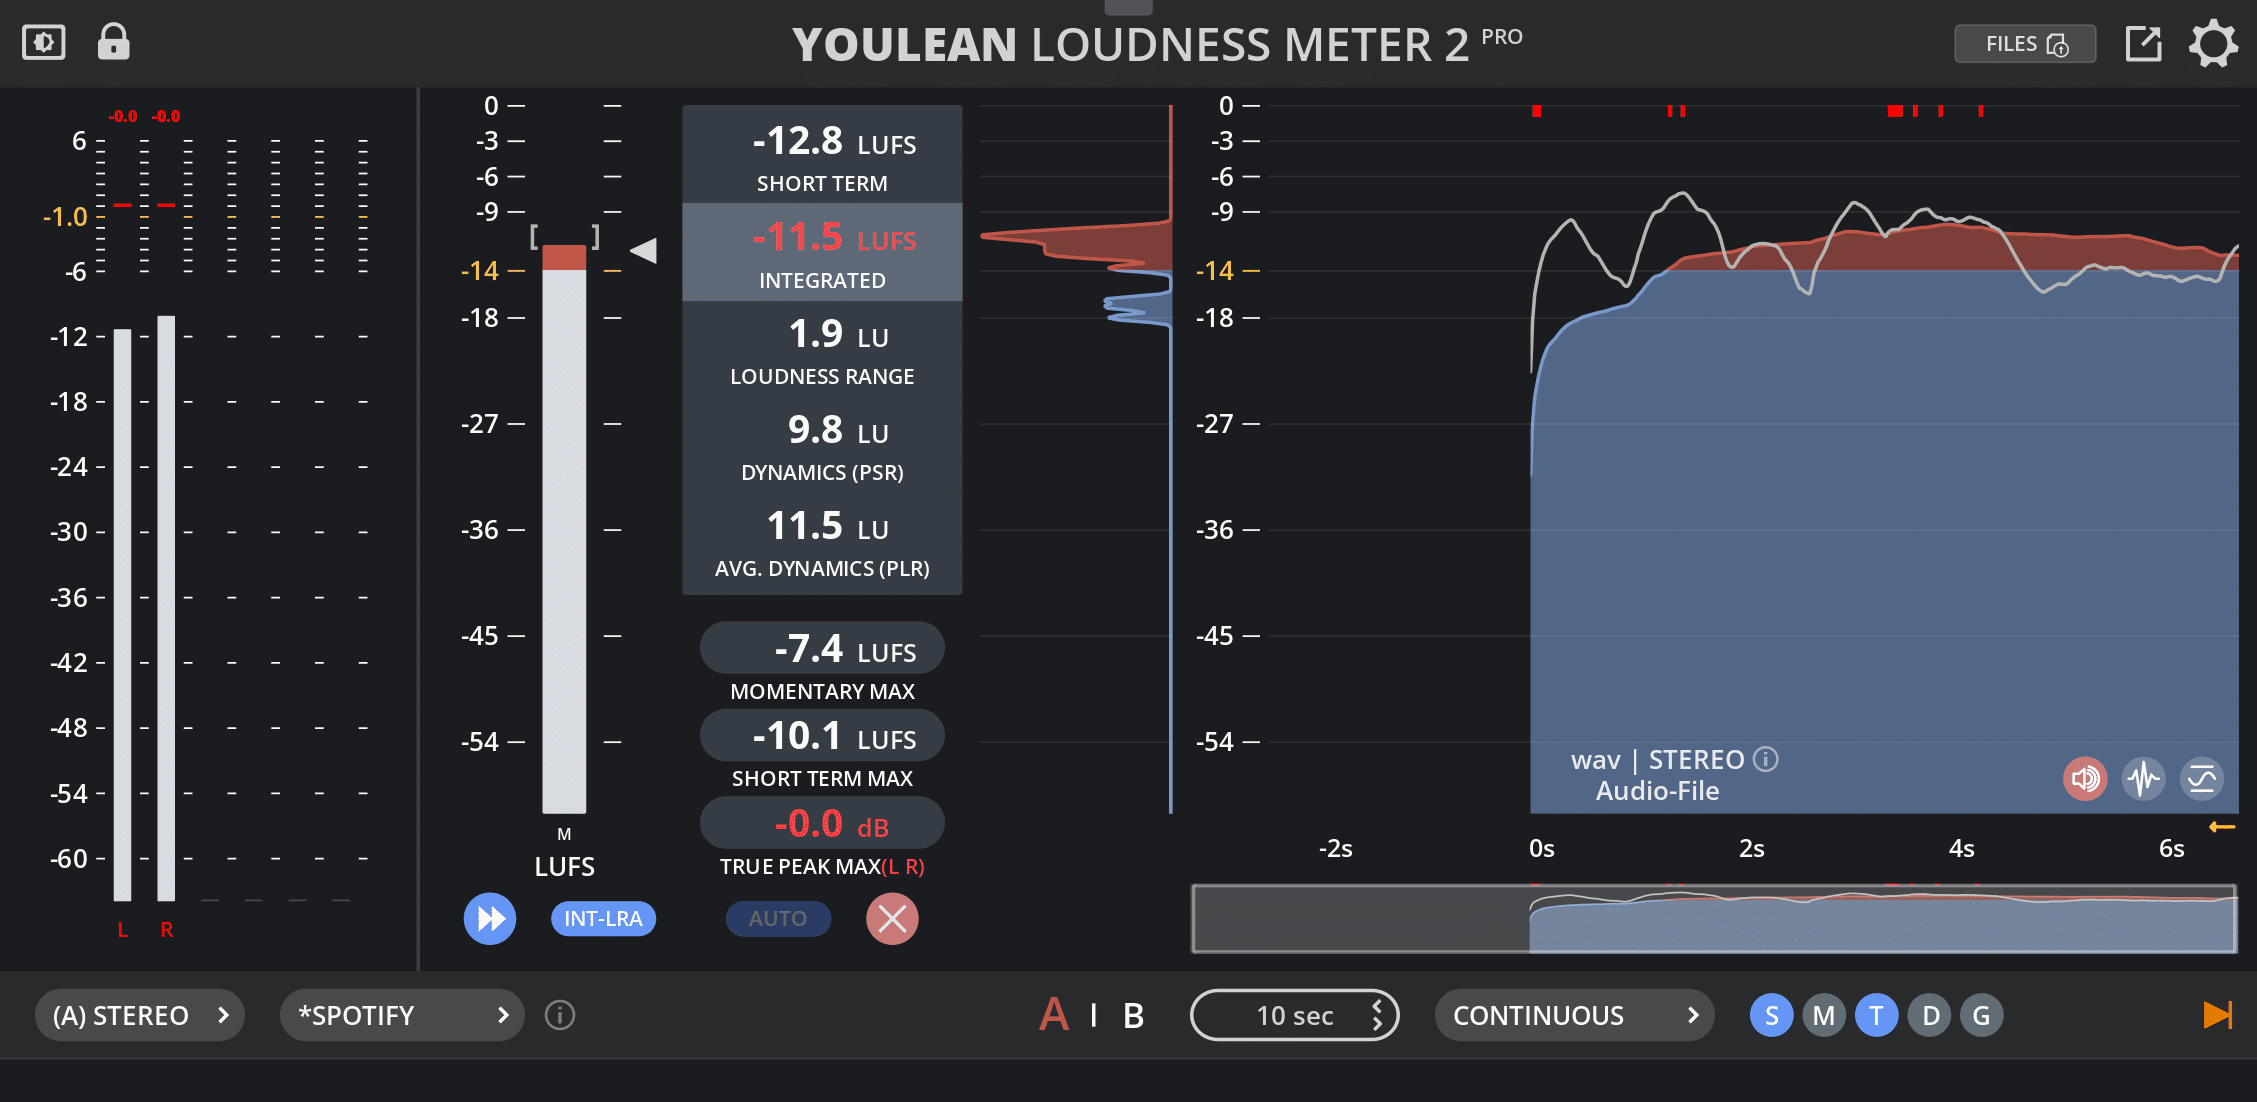
To the very left of the plugin, you’ll recognize a meter bar similar to those in your DAW (see (1) in Image 1). This one has LUFS as units. The bar displays the momentary loudness, which is an average over 400 ms.
You can use it to see how fast the loudness fluctuates. This gives you a visualization of whether what you’re hearing is steady or if it’s groovy.

Image 1: Meter bar (1) together with momentary (2) and short-term (3) loudness.
Short-term Loudness
The triangular pointer to the right of the bar shows the short-term loudness, which is the loudness averaged over 3 seconds. The precise value can be viewed in the top readout next to the bar (2). This is useful to check the loudness of the current part of the song.
One approach is to play back the loudest segment of the song (often the chorus to the end) and set your master gain or limiter in order to achieve the loudness you have in mind, while monitoring the short-term loudness. Note that, in this case, the value will often be higher than the average (or target) loudness of the full song. Which brings us to the …
Integrated Loudness: one of the most crucial parameters of the plugin
The integrated loudness (3) is the loudness measured over the entire song or playback (since the last reset).
This is what you should watch out to be compliant to the rules of the platforms you are aiming to release on. For instance, Youtube streams audio at -14 LUFS (integrated). (Find more info on the platforms’ requirements in the blog post Loudness Standards – Full Comparison Table).
The easiest way to measure the integrated loudness is to drop the song on the plugin (Pro version), it will analyse it in seconds. Otherwise, you can play back the whole song and enjoy watching the values moving along.
Then see by how many LUFS you’re off your target and increase the master limiter gain (or lower the maximizer’s threshold) by more than that number. Be careful not to introduce distortion by being too hard on the boosting.
If you try to get louder an already loud song you have to push even more. For instance, with a maximizer threshold set to -4 dB, a song that is -14.2 LUFS may reach -10.8 LUFS (so +3.4 LU) whereas a song that is at -9 LUFS will get to -6.5 LUFS (+2.5 LU).
Now, if you want to have a broader view of your song there are other sections in the plugin for that (see Image 2 below).

Image 2: Histogram (4), distribution (5) and momentary (6) and short-term (7) loudness maxima.
Histogram (4)
The histogram represents the loudness over time. With it you can follow the loudness evolution in real time. Press the ‘S’ or ‘M’ buttons at the bottom to display the short-term and/or momentary loudness (as shown in Image 3 below).
The histogram also allows you to go back and see what happened at any stage of your song. You might need to press the ‘stop follow’ button in the bottom right corner (Image 3) if you are playing back music.
By the way, by hovering the mouse over the histogram you can get the info about the point in time the mouse is at (displayed in Image 3).

Image 3: Useful buttons for the histogram. The white trace on the histogram is the momentary loudness. Some info is displayed when hovering the mouse over the histogram.
In most genres, you can see the bumps and dips in the short-term loudness due to specific sounds. But in some highly compressed genres like techno, short-term and momentary follow each other closely (see Image 4).

Image 4: Comparison of 2 different genres. Left: a pop song, right: a techno track. The momentary loudness (white trace) differs from the short-term in the pop song.
Distribution (5)
In Image 2, to the left of the histogram, we have the distribution of the loudness. All the short-term loudness values are remembered and displayed as horizontal peaks (or bumps) pointing to the left. The longer your song goes around a certain loudness value the longer will be the peak at that value.
If you have a consistent loudness throughout your song, the distribution will reveal a rather thin peak at that loudness value (see right-hand side of Image 4). If the choruses are at a specific loudness and the verses at another (with not much more in between) you will get 2 main peaks (see Image 5). This is a useful way to have a quick and condensed overview of the loudness of the song.
By the way, you can set a loudness target and this will split the histogram and distribution (as well as the meter bar) in two colours. You can then see right away how much of the song is above the target loudness.
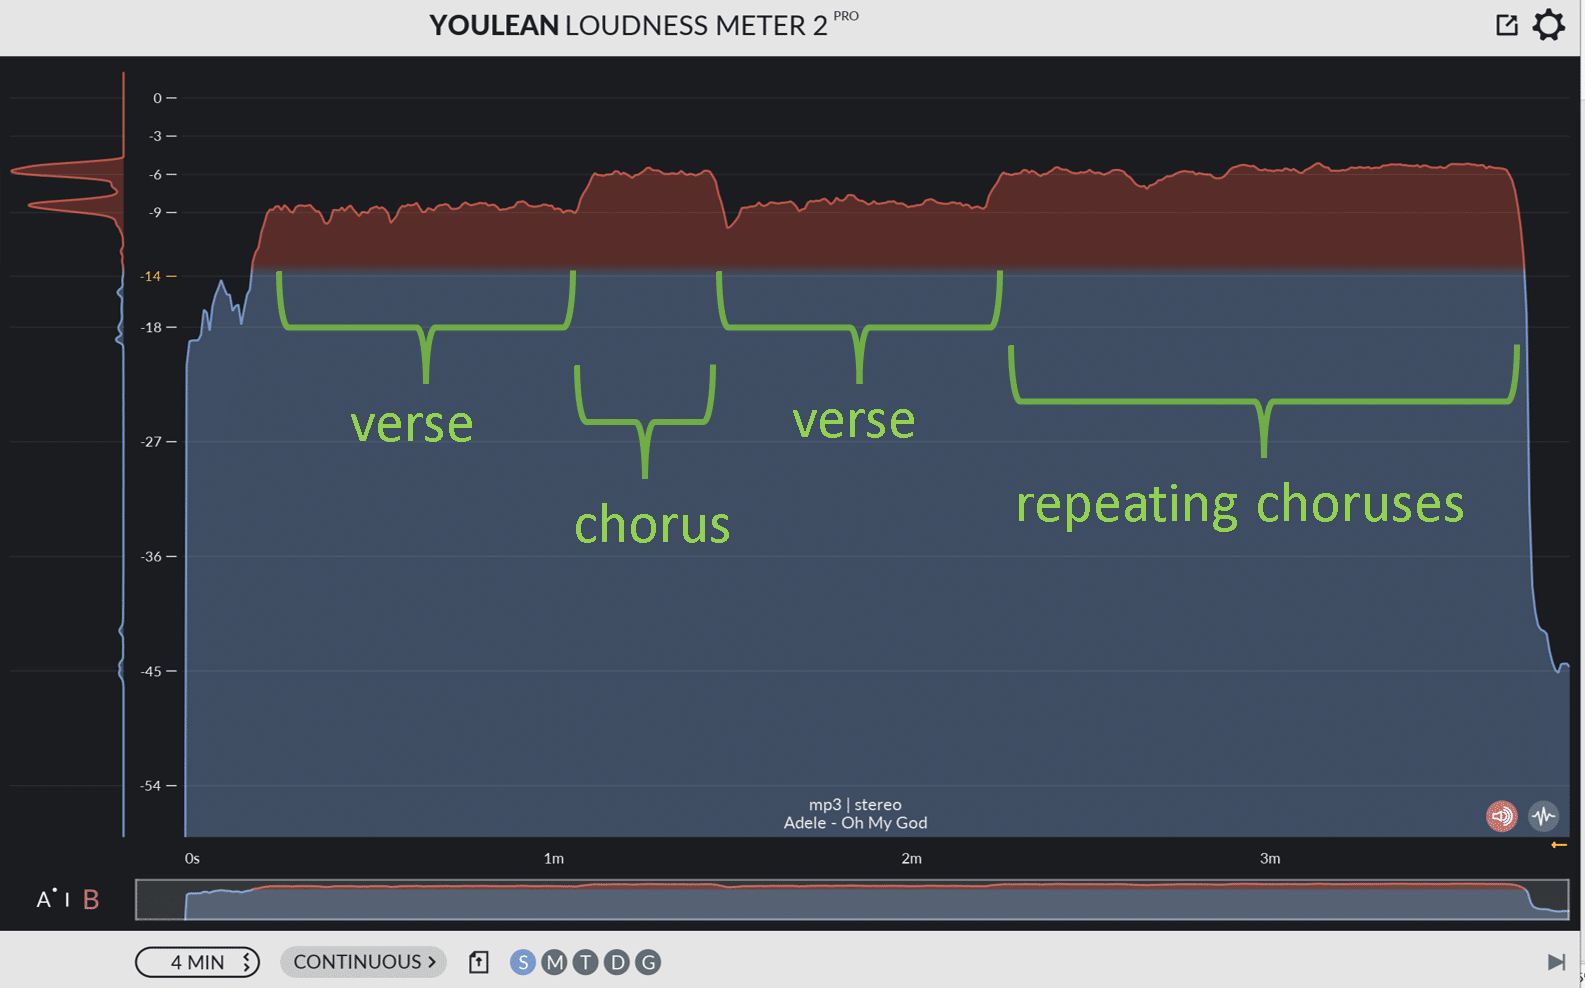
Image 5: Visualisation of the song with the histogram and the distribution.
Max values
Lastly, the plugin remembers the maximum values of the momentary (6) and short-term loudness (7) so you don’t have to search for them in the histogram (see Image 2).
To meet the expectations in the genre of your song, you should use the plugin with a few successful commercial releases. You’ll get to know what are the loudness values that work.
The True Peak
The other most crucial parameter of the plugin.
Why is it so important?
You should keep all peaks below 0 dB. An audio waveform cannot be reproduced over 0 dB in the physical world. Everything above will be clipped and distortion might be audible (which is wisely called clipping).
Why do we talk about true peak?
A normal peak is a datapoint of the digital waveform with a high value (often close to 0 dB). True Peak (TP) however, is not a value stored in the digital waveform. It is the estimate maximum value of a waveform between two datapoints thereby its other name: inter-sample peak.
Meters that don’t measure TP won’t necessarily raise a flag when the waveform goes over 0 dB!
If this is somewhat obscure to you: take a look at the waveform in Image 6. Above, you can see a (true) peak of the waveform crossing the 0 dB value (red line). Yet a traditional meter will measure a (non-true) peak at -0.5 dB. In the blow-up (bottom image) you can understand why: the values of the waveform’s samples, the little dots, are indeed below 0 dB.

Image 6: Audio waveform (green line) crossing 0 dB (red line) in at least one occasion. Top: large scale view, bottom: blow-up showing the sample datapoints.
To relate to TP, recommendations make use of the unit dBTP, which means dB for the TP. Most streaming platforms recommend -1 dBTP, sometimes even -2 dBTP. This is because they stream audio at lossy formats (such as MP3, AAC, etc.) and during the conversion from a lossless format (like WAV), the volume can increase by approximately 1 dB.
Practically, play back the passage of the song that you spotted the most true-peak alerts, and lower the ceiling of the master limiter or maximizer until the alerts are gone. For instance, in Image 7 you can see that before lowering the ceiling of the master limiter there were some alerts (red spots). They signify that the TP was above the target (here -1 dB). In this case, lowering the ceiling to -2.5 dB worked to keep the TP under control.

Image 7: Histogram of the TP. Peaks stained in red are above the target (here -1 dB). After lowering enough the ceiling of the master limiter, the alerts are gone.
Once you’ve found the correct ceiling setting, check that it works for the whole song.
Then doublecheck that the integrated loudness has not been reduced (too much) due to the limiting. You might need to adjust the loudness and then the TP again.
The Dynamics Measurements
With the histogram and the distribution, you can get some info about the dynamics of the song, but the plugin can also give you values so you have a precise analysis of the song’s dynamics.
Dynamics is multiple-meaning word in music production.
The plugin covers 3 measurements of the dynamics (yellow boxes in Image 8).
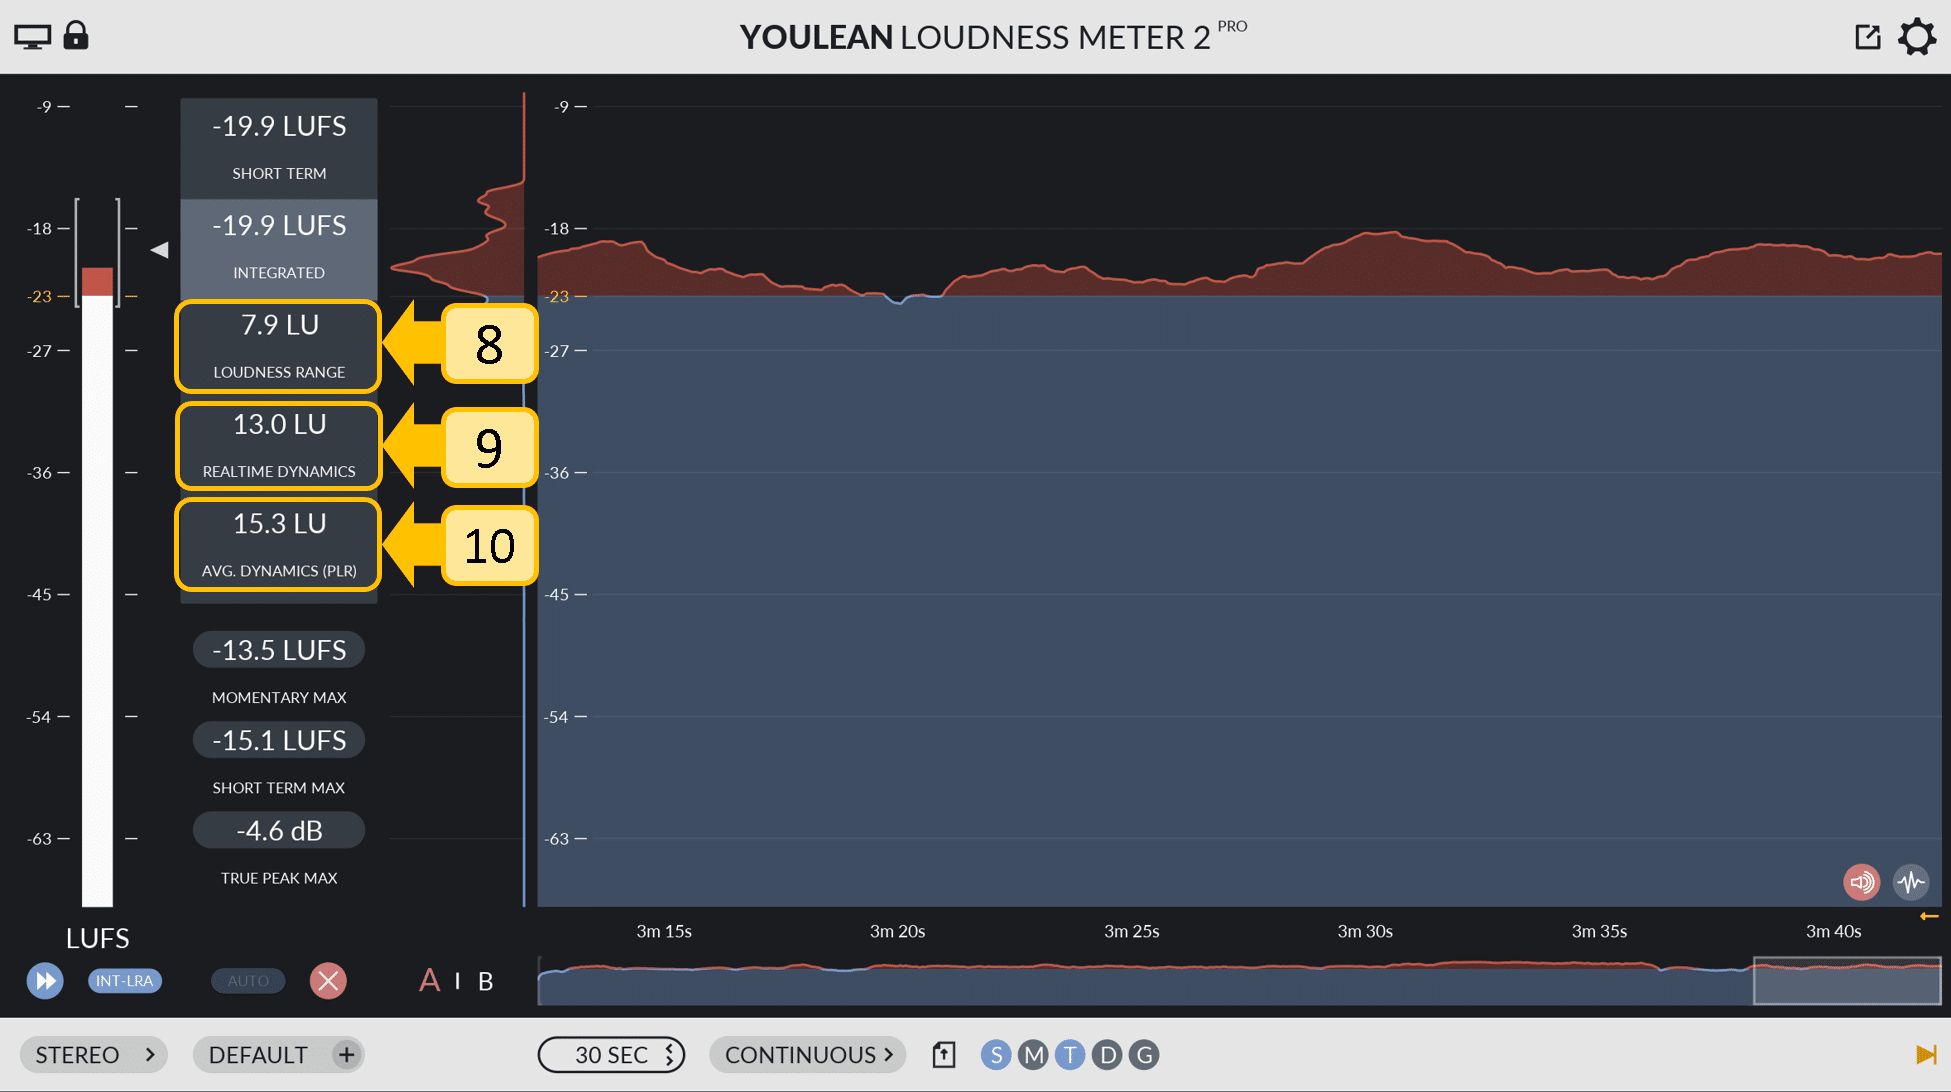
Image 8: Dynamics measurement readouts.
Loudness Range (8)
This is the loudness difference between loud (like choruses) and quiet parts (like verses) of the
song. You can check this and adjust it to your taste (for example using gain automation or
compression). Depending on the genre this value might be around 8 LU. By the way, did you notice
the brackets around the meter bar? These represent the loudness range!
Realtime Dynamics (9)
This is the amount of (non-)compression of the song at certain point in time. It is the difference
between the TP and the short-term loudness. This describes how compressed your song is and helps
you understand if the transients are piercing through or if they’re squashed to about the same
loudness as the rest.
Average Dynamics (10)
This represents the difference between the maximum peak and the integrated loudness. This
feature is also known as Peak-to-Loudness ratio (PLR). You guessed it, here, we are talking about the
true peak.
You can compare PLR to the headroom of the platform your aim to upload your song. The headroom
is the difference between the recommended TP and integrated loudness. For instance, the headroom
of Spotify is 13 LU. Usually, PLR is lower than the headroom.
As a bonus, the Pro version has a nice-looking and handy histogram of the realtime dynamics (see
Image 9).
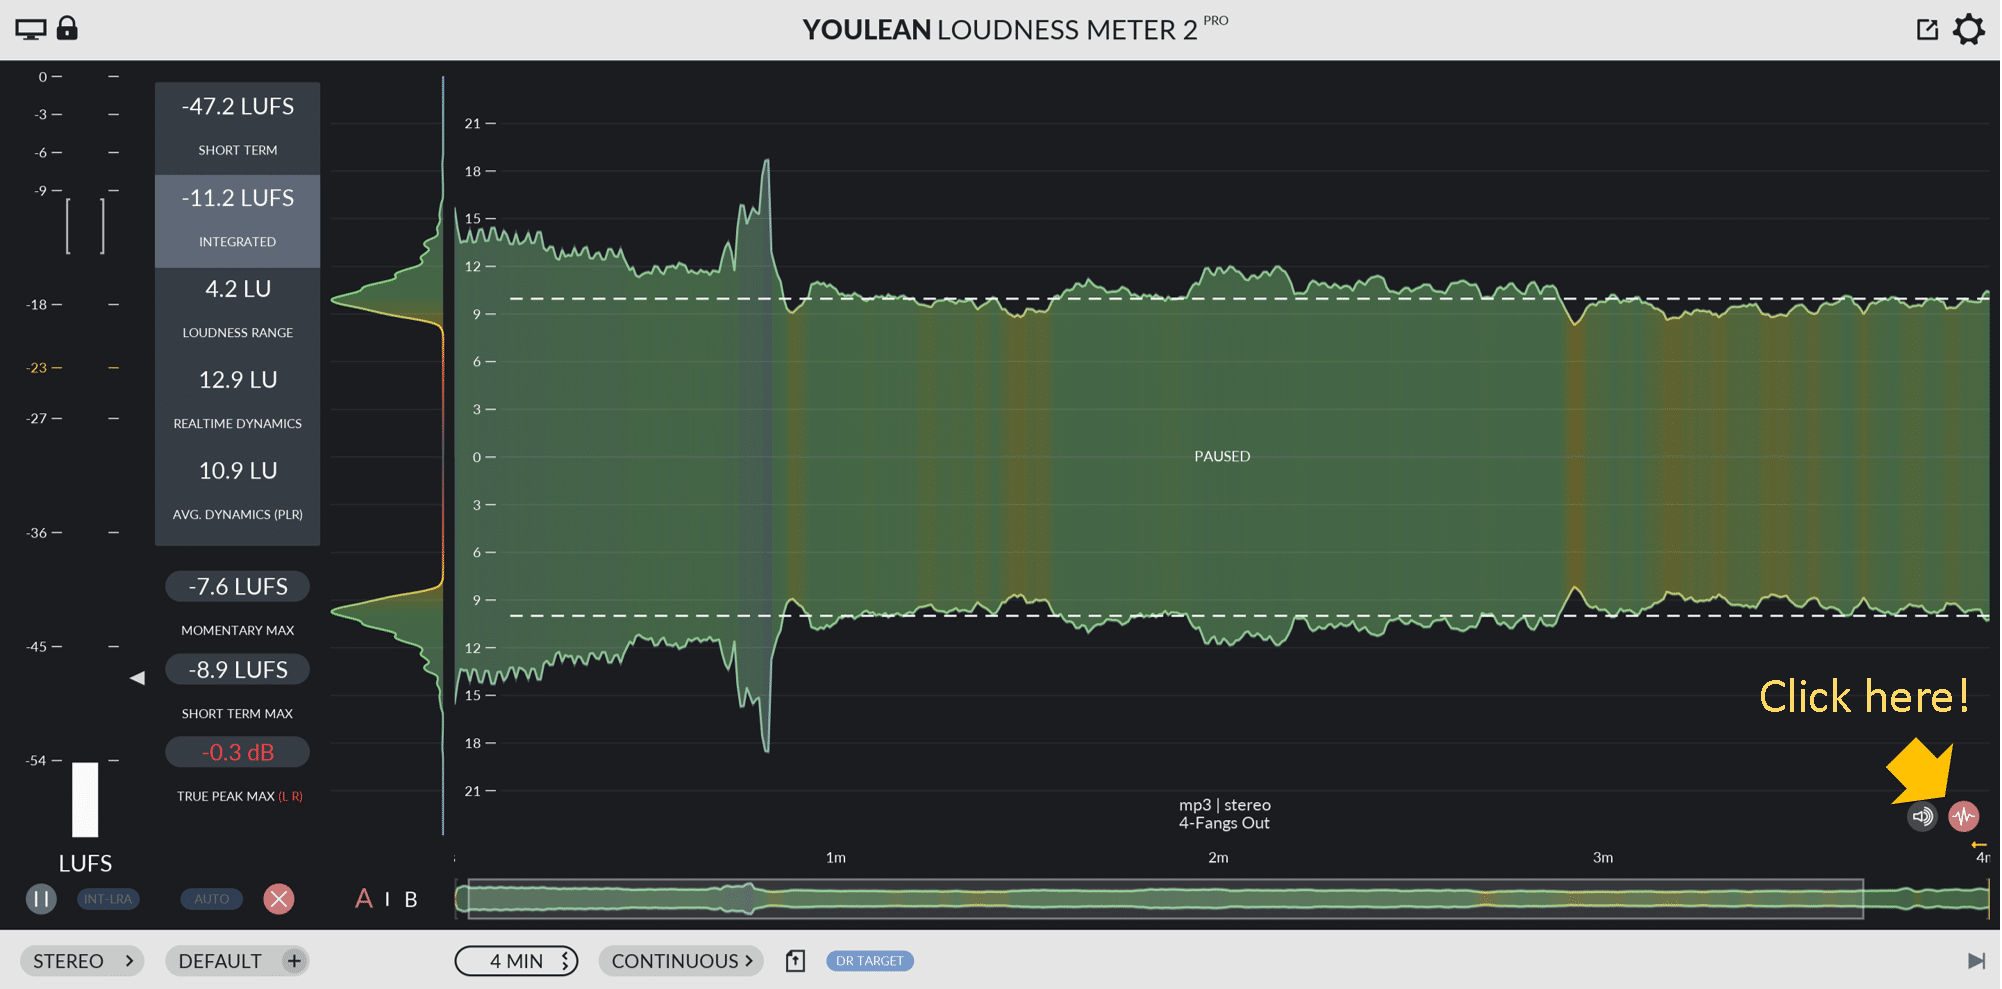
Image 9: Dynamics histogram and distribution views.
The trade-off
Compressing allows your song to be louder at the expense of the dynamics. So, logically the
loudest parts of the songs are often those with less dynamics (see Image 10).
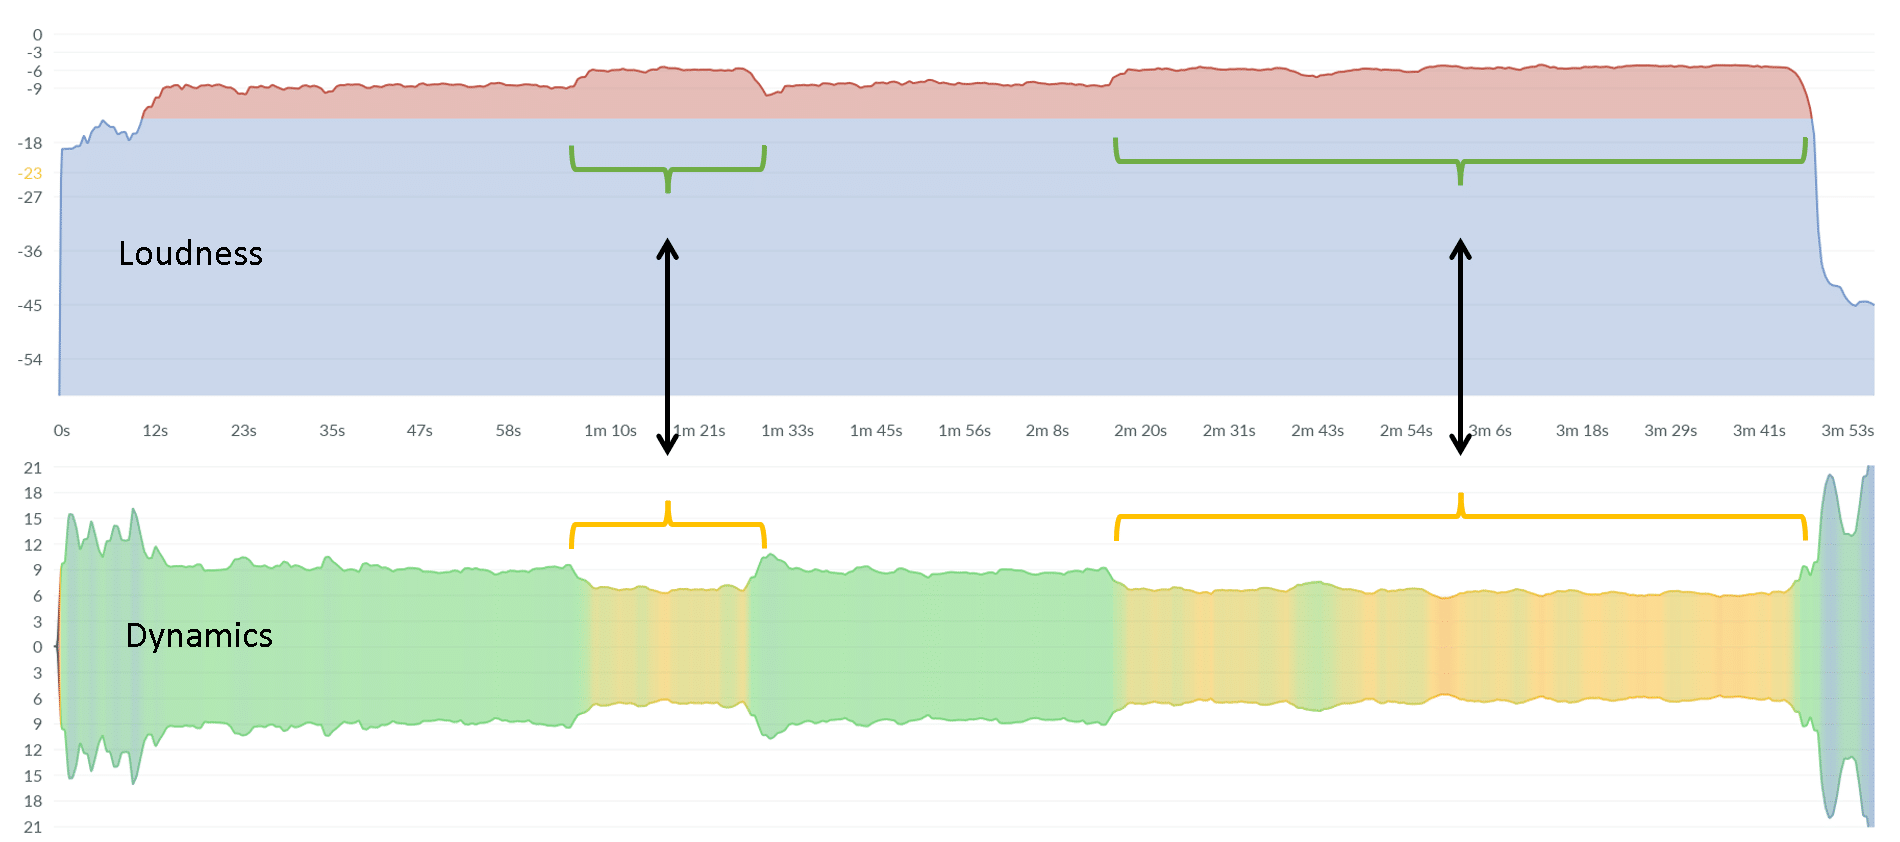
Image 10: Histograms of the loudness and dynamics of a pop song.
For all three types of dynamics, the best you can do is analyse successful releases in the genre of your song and aim for the same kind of numbers.

Very useful information! Thanks!
Thank you for taking the time and reading the whole article! 🙂 More explanation articles are coming! if you have any specific requests, feel free to leave a comment.
Hello, this has explained a lot to me but I’m curious why I see some Youlean meters have a Dynamic Range and some don’t . Why is that? Thanks
Older versions didn’t have it. 🙂
I know very little about LUFS and all the different ones YouLean can measure, so this was very helpful to get to know what everything means. But I wish this post would tell me if a higher number is also a higher volume if we talk about LUFS. is -30 LUFS louder than -20 LUFS for example?
Great to hear that!
-30 is less than -20!
first had the free version… few weeks later got the upgrade and now it’s a standard plugin on all my projects… before this it was kinda like fishing in the dark…
PLUGIN OF THE YEAR ! ! ! 🙂
Awesome to hear that!
Bought the plugin and use it to check every song and album. A workhorse plugin – great stuff.
“As a bonus, the Pro version has a nice-looking and handy histogram of the realtime dynamics”
Would it be possible to add a PSR histogram too? You could switch between the two like the two buttons for the short-term & momentary LUFS. (Or even a single toggle button.)
…and a small thing, to add ‘PSR’ to the realtime dynamics label. I spent up till this post trying to find if and where it was in the plugin.
much thanks for all that you are doing.
Luke
The Midi Doctor
Sorry I got it wrong. It does show the realtime dynamics. Please delete that comment – or that part of it.
I’m still researching this, due to the new True:Level plugin from Sonible. Their dynamics range is using PSR, but they’ve created a single median value for the whole song, which I’ve not seen anywhere else.
They say in the manual that their experiments showed,’better traces of actual dynamics of a track’.
Seems to me that they’re negating what PLR is for. In any case it gives a different value than PLR. -14.8dB compared to 11.7dB PLR as shown in Youlean.
What do you think of this? Could it be added to Youlean? Is it useful or valuable?
thanks,
Luke
I don’t know. PLR is max true peak – integrated loudness. There is nothing that I can change there.
I’ll give it an attempt; When I master my track in FL (Obv. w. help off the Loudness Meter 2 Pro), it sounds good and all, but when I distribute it and listen to it on Spotify a month later, most of my tracks have been lowered down quite a bit. Normally, my integrated is at -14LUFS and a Loudness Range at 5.0LU. It never peaks above 0.0, and I always aim for a true peak max at 1.0, even though it normally hits about 0.8. Any ideas on what i’m doing wrong? I’d like my tracks to be just as loud as all other tracks, but they always feel underwhealming.
* -1.0 true peak and it normally hits -0.8.
You can hear a difference if you have disabled audio normalization in the Spotify.
Hi! loving your loudness meter 🙂 However every time I hit Stop on the DAW (Pro Tools at the moment) the histogram jumps back to TC 00:00:00:00. Is there a way of having it stay where the PT playhead stops?
This will be fixed in V2.5.3 which will be released as the next BETA update.
Currently mixing/mastering a track, and the integrated LUFS is at -16, Loudness range: 3.5LU. True peak max is at -0.1. How do I reach -11LUFS without going into the positive at the true peak. How can I lower the true peak but raise the LUFS integrated? 🙂
You would need some audio limiter for that.
I’m a teacher, and my class is to loud.!
This helps a lot. Thanks.
why 400ms? I know that algorithm based on the ITU-R BS.1770(400ms Block gating), but why why 400ms?
This is because 400ms best approximates our hearing for short sounds.
Hi, nice plugin I’ve been using it to check out a Mastered Mix of mine. I’m not sure how to use it. Is there any youtube videos on how? Thank you
How can I keep the histogram to check back after the pass? Every time I hit stop it deletes everything, Even if I choose timecode. The only way is to choose continuous, but I will lose the timecode reference in this case. What am I doing wrong?
You will need to disable auto reset. Just click on the “AUTO” button next to the reset button.
I could not find a way to change the metering between LUFS and LKFS in the settings, other than loading different presets that use both options. How can we change it?
Yeah, there isn’t a way to change this manually. But there is no difference between measurements. It’s just a naming.
Hi Sir, Great Plugin, thank you!
Can you tell me how i can enable milliseconds in the histogram screen? When scrubbing through the timeline trying to hone in on peaks, it’s difficult to locate the exact point on the timeline where the waveform peaks as i can only see incremental changes of 1 second when scrubbing on the graph…..
Maximum resolution for peak graph is 10ms, but the window size can only go as low as 1s (if you double click on the knob and type it)