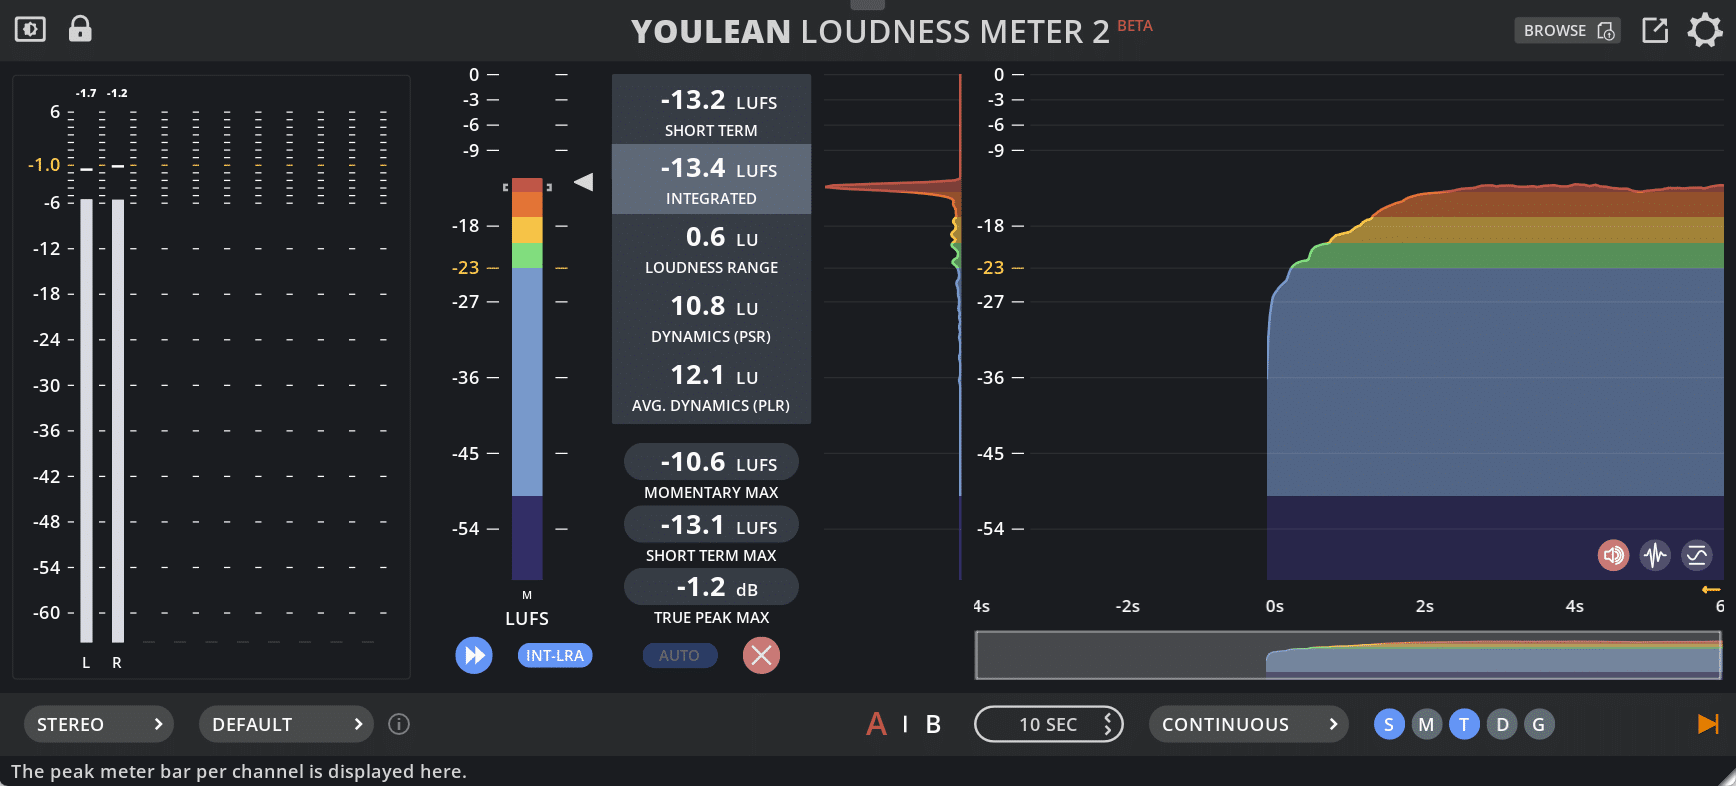
First of all, thank you for recommending the Youlean Loudness Meter!
There are a lot of exciting and groundbreaking features added in this update, so let me tell you about the most important ones:
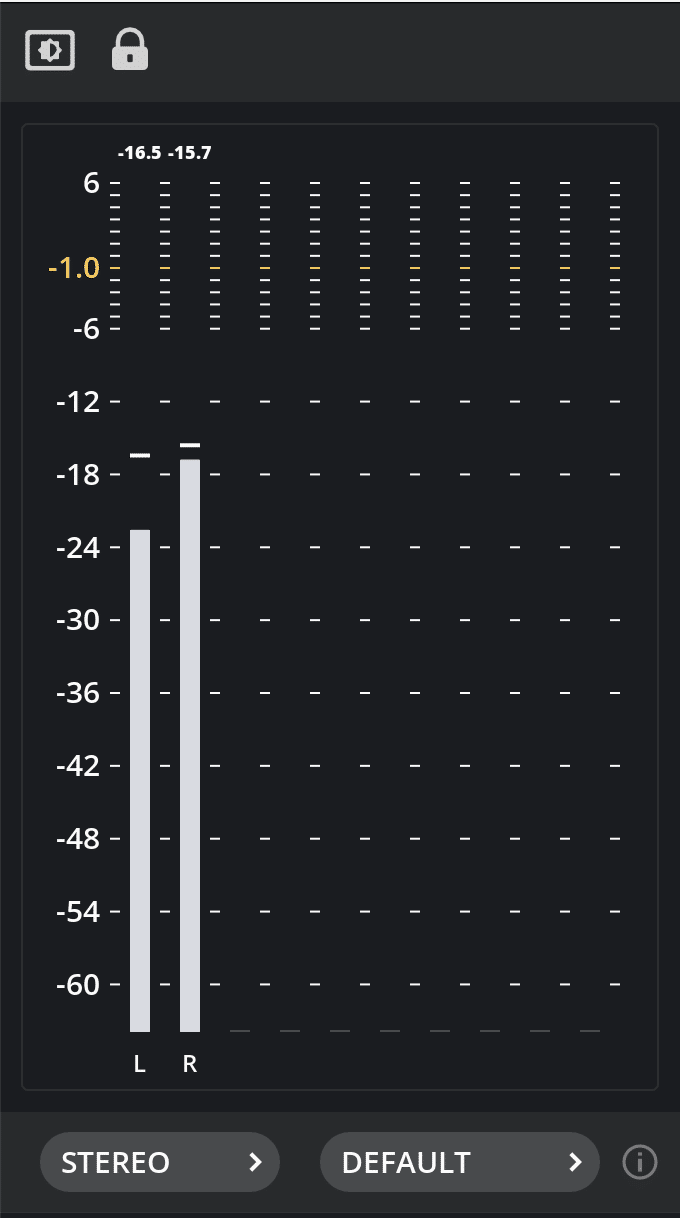
Peak Meters
This feature was requested by many of you, and it is finally here. I also really like it and find it surprisingly useful. You can see per channel true peak values at the top, and if something goes over the threshold, it will be displayed in red.
Preset Import/Export
I was never satisfied with the preset manager in YLM. The last beta has changed implementation a bit, but I think this update will finally have a system that will be enjoyed by everybody.
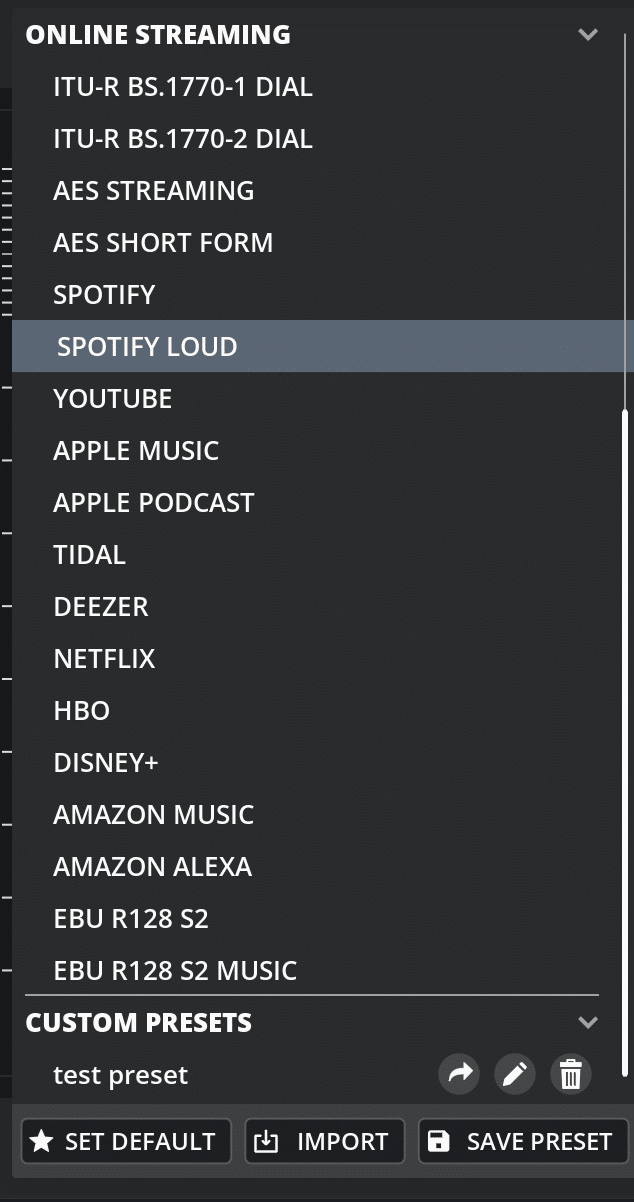
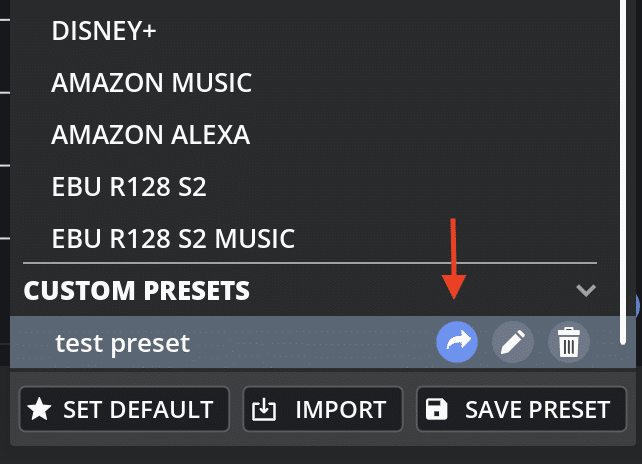
As you can see, now we have 3 always visible buttons in the preset drop-down menu. The option that was added is a button to set the preset as the default. This could be done in the previous versions too, but it was a bit hidden. Now when you set the preset as default, you will see the start icon next to the preset, and that preset will be automatically loaded once you load a new plugin or open the app for the first time.
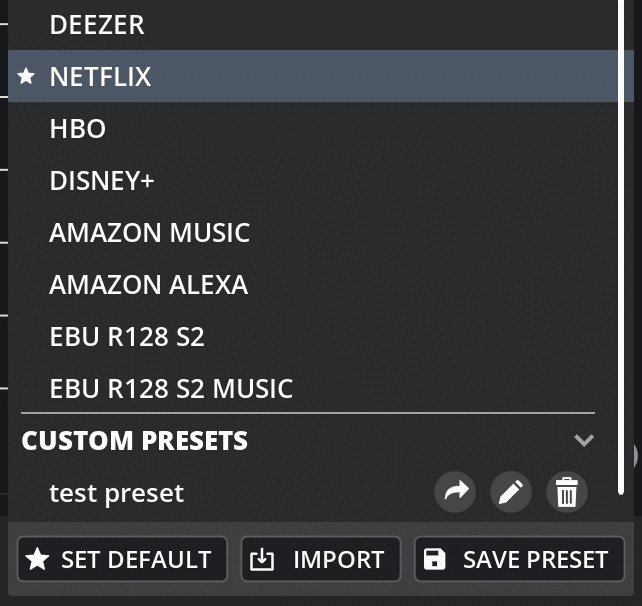
You can share a preset using this button. The shared presets could be imported into other machines. You may wonder why we need separate share and import buttons when you can just copy the preset folder to a new machine. This is because if you import presets, you won’t break your old save sessions.
If you want to copy all presets and don’t care about compatibility with old sessions, you may open and copy this folder to the same path on the new machine:
Windows: C:\Users\***username***\AppData\Local\Youlean\Youlean Loudness Meter\Presets
macOS: ~/Library/Application Support/Youlean/Youlean Loudness Meter 2/Presets
More Loudness Colors
This is the number 1 feature that was requested over the last few years. The feature was delayed a couple of times as it required a lot of changes under the hood. Who would it thought that this would be complicated to be implemented… The main problem with the implementation was my decision 6 years ago where I thought 3 colors will be good enough. Fortunately, I was able to work this through, and now we have much more colors and a system where I could add more colors without the need to rewrite 10.000 lines of code.
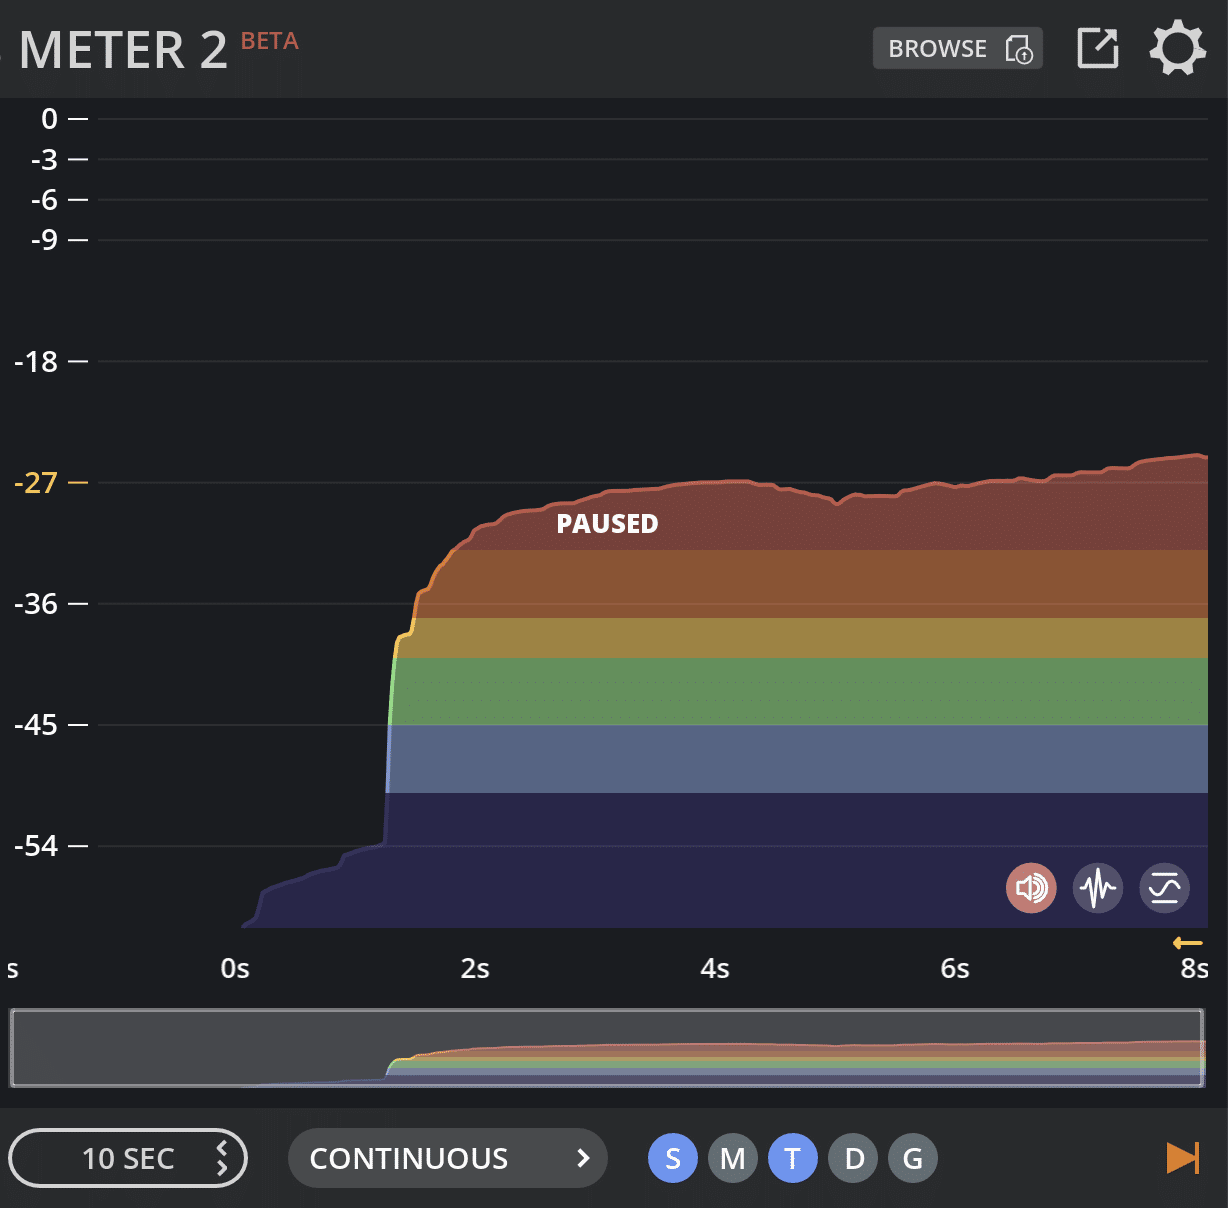
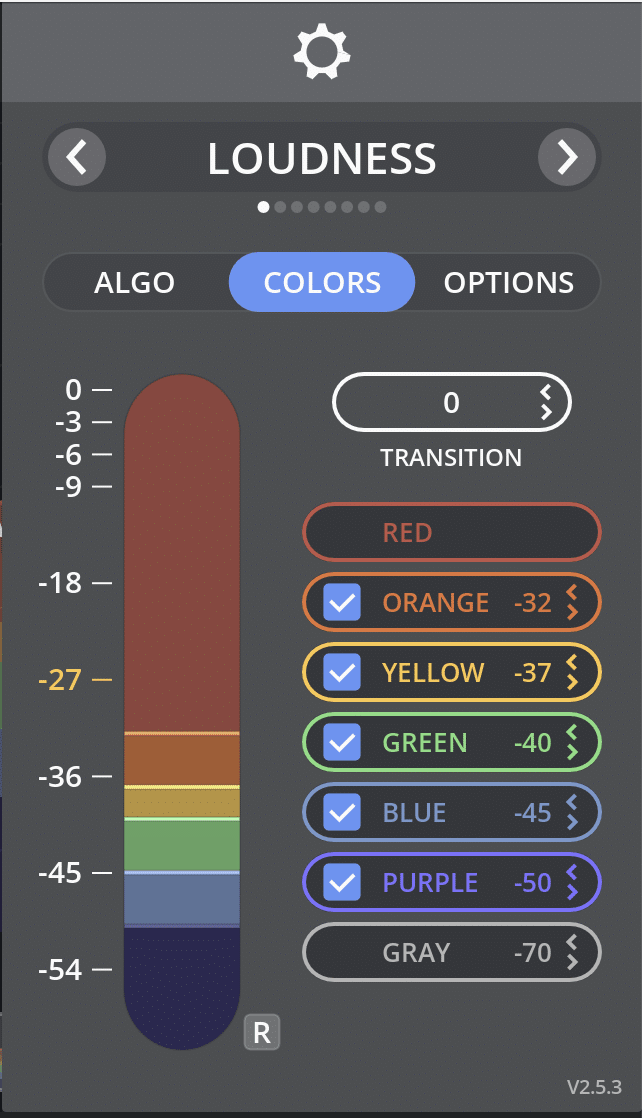
You can set the colors here in the settings menu (image below). You can drag the colored bar, or use knobs. You can also double-click on it to enter the value manually.
As a bonus, I was thinking – wouldn’t it be nice to have loudness colors separated vertically based on the thresholds? So this was implemented too:
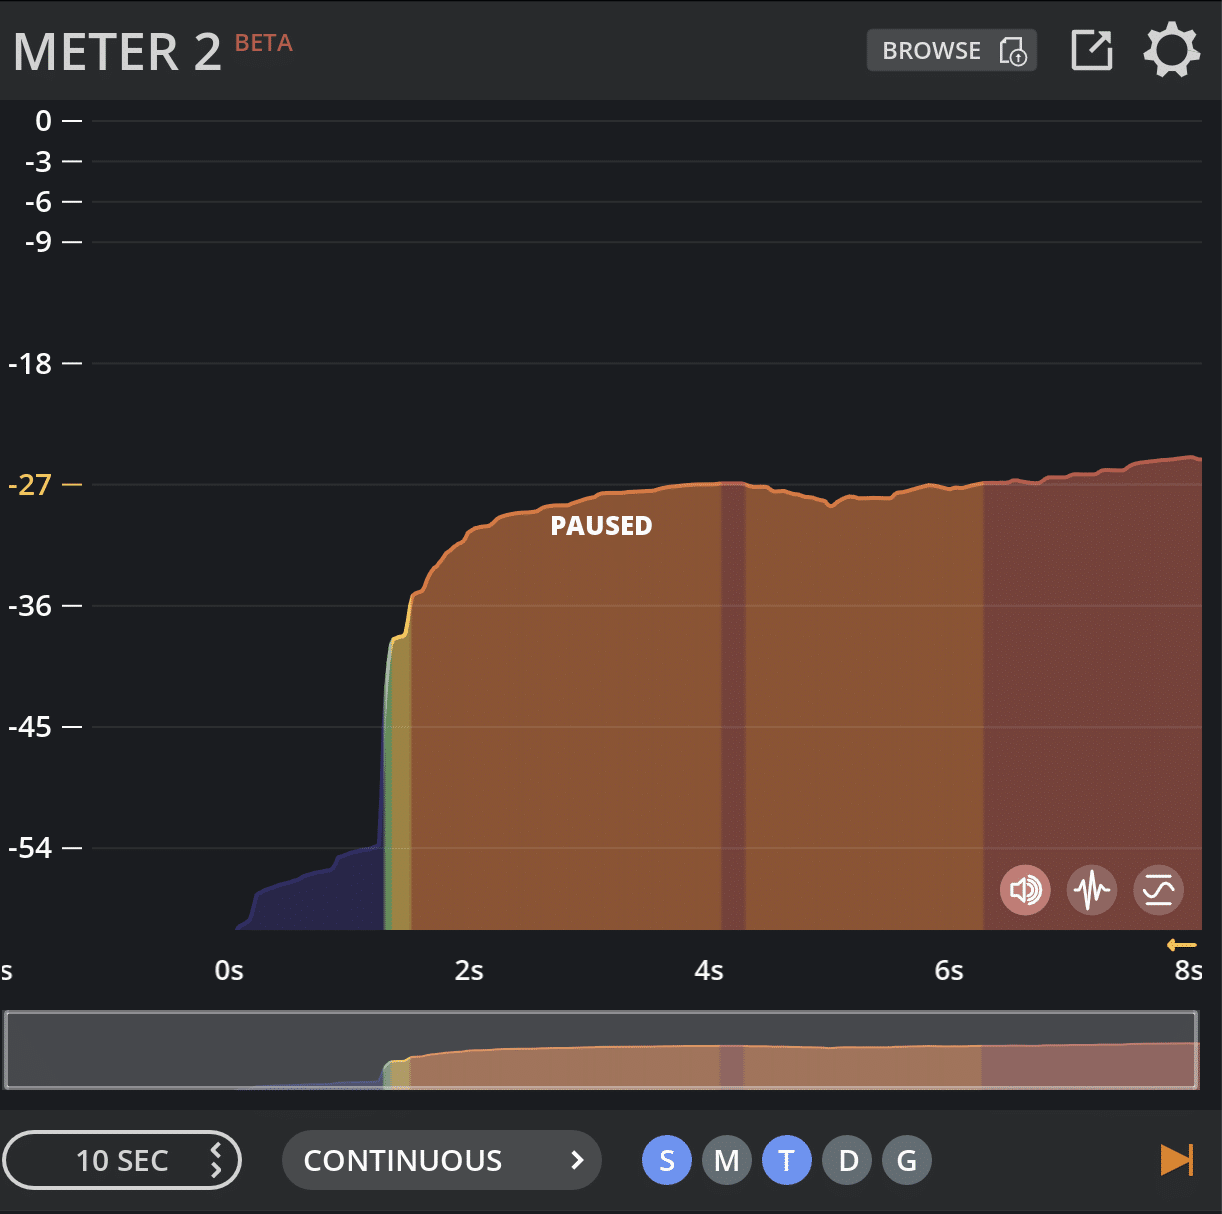
And this one is not available on any other meter, and I think it is actually more useful than horizontal separation. Here (image below) you can see exactly in what part of the graph you are clipping for example. Here you can change this setting. Experiment with it and let me know if you find it more useful.
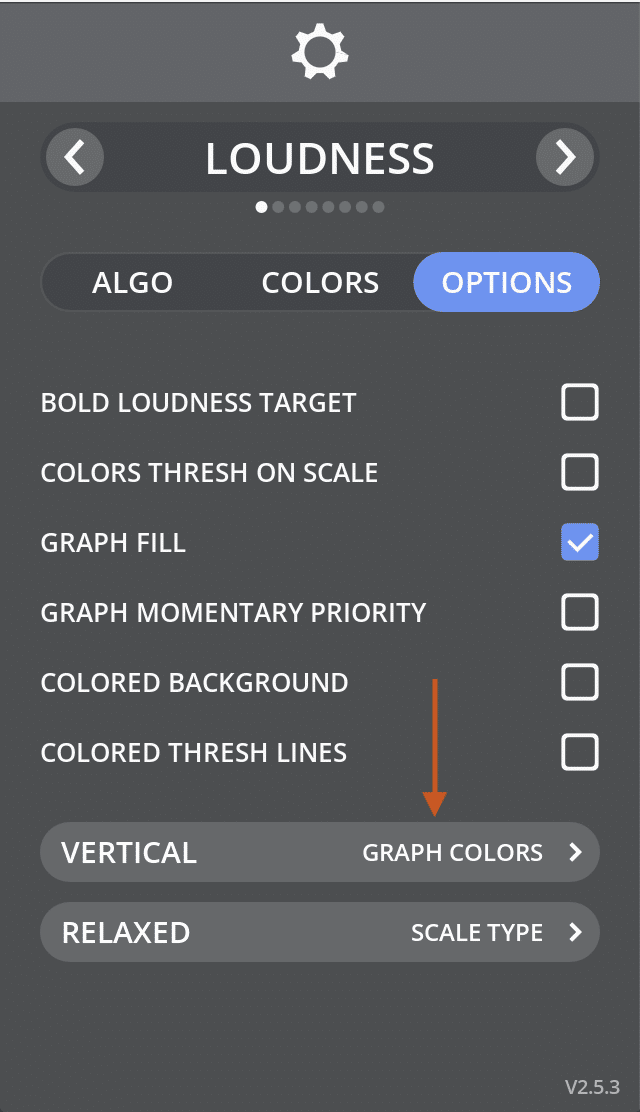
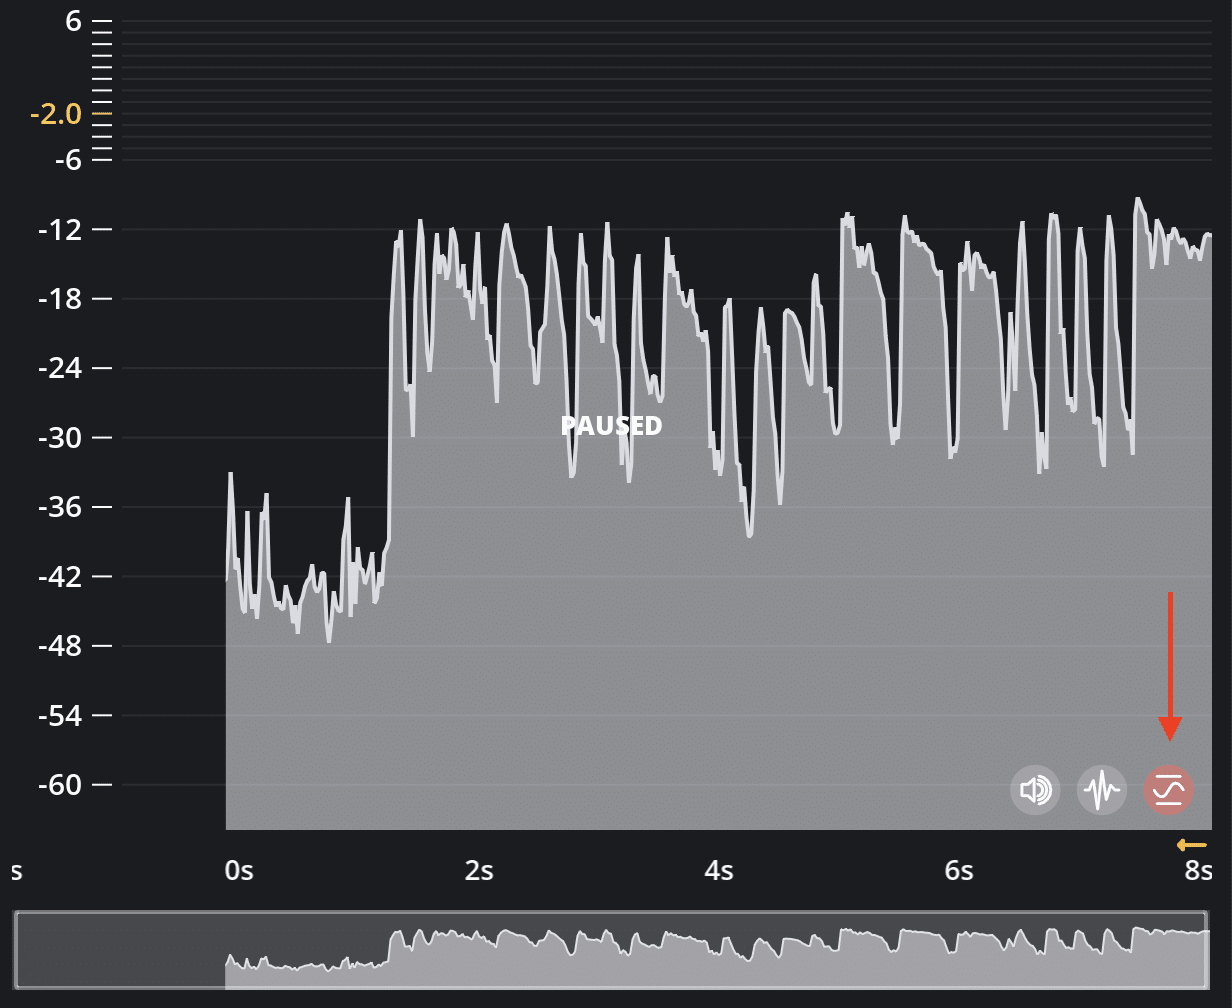
As you can see, there are a lot more options now available for the graphs, so experiment with them. I would point out that if you enable “GRAPH MOMENTARY PRIORITY”, you will have colored momentary graphs by default. This version has also separated the true peak graph where it can be easily switched too.
More GUI Customizations
I got some complaints that the colors in the graph are a bit washed out and that some users on lower quality monitors couldn’t see it properly. This is a bigger problem when you have more colors that are similar, like orange and red. That’s why I have added an option where you can set color opacity, contrast, and saturation for graphs. Now you can make your colors as ugly as you want. 😀
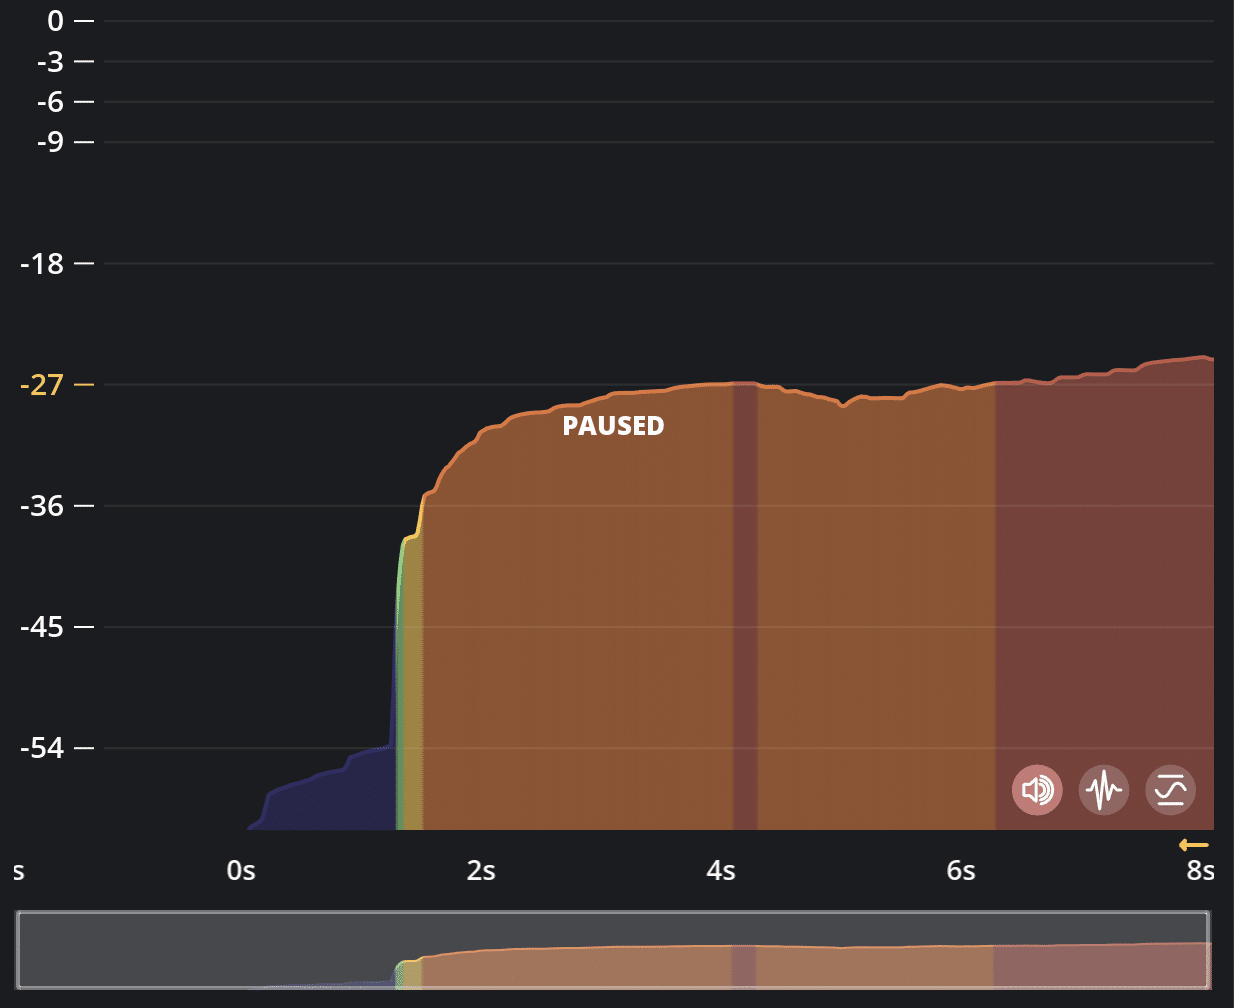
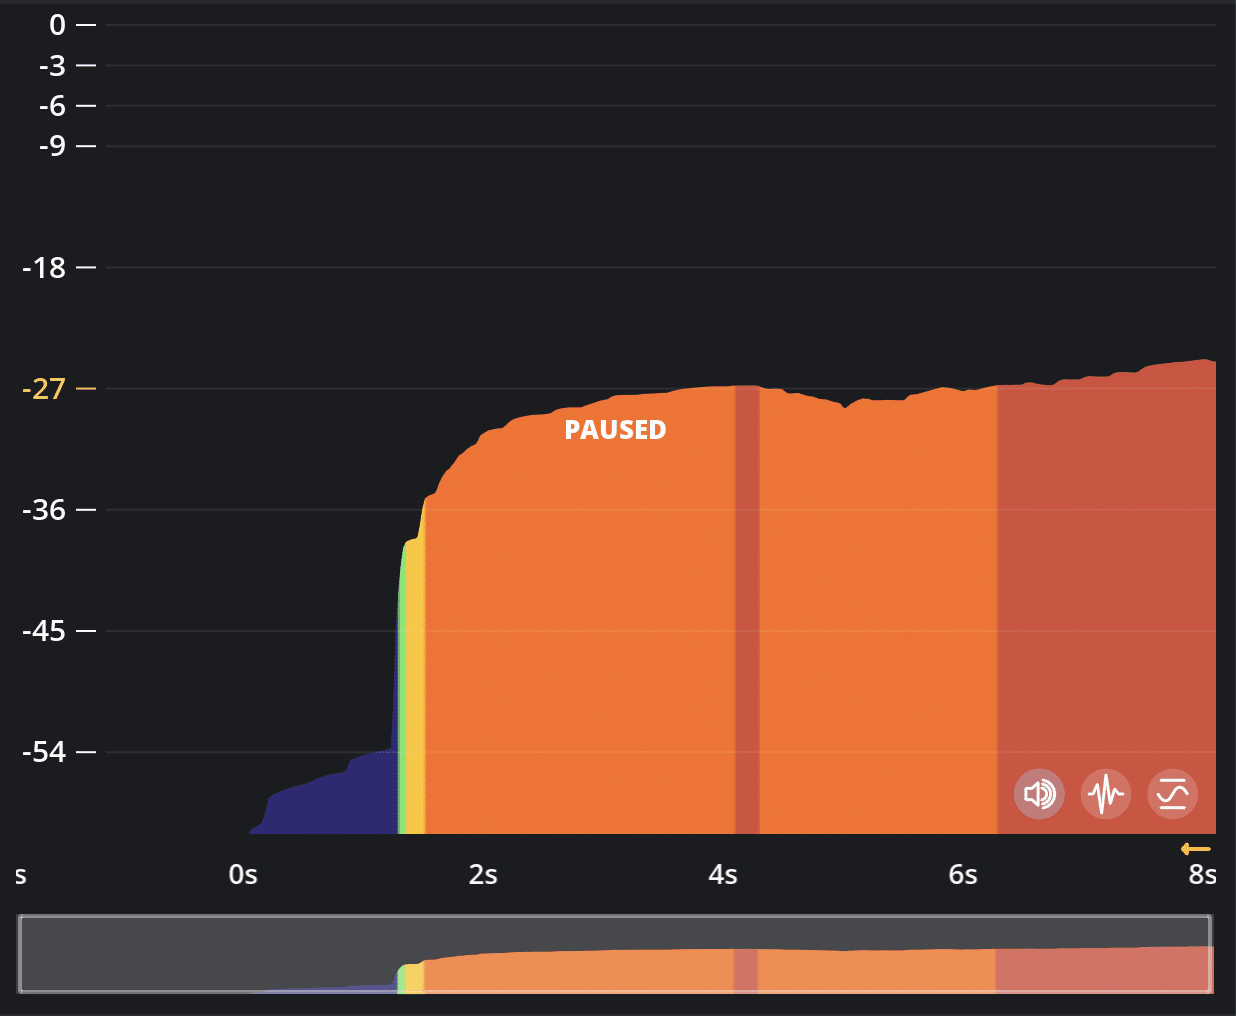
You can change this setting in the view meny.
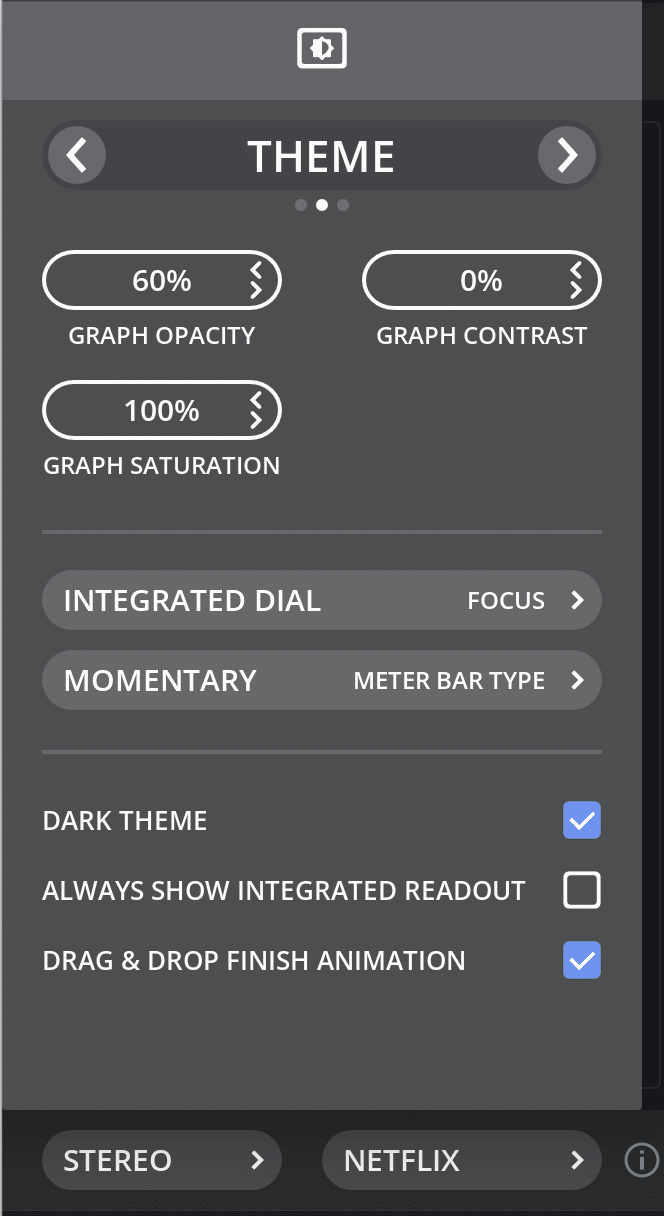
Better GUI Performance
Since I had to rewrite a lot of code in order to implement new features for colored graphs, I took the opportunity to optimize the graph drawing code. The graph drawing was never slow, to begin with, but I get a lot of satisfaction for improving performance even a tiny bit. Now the graph drawing is significantly faster. The speed up is 2x or more. If you have a good machine you won’t notice a thing, but for all of those with older machines, the improvements will be more than welcome.
Better DSP Performance
While a GUI performance optimization was fun to do, DSP optimizations were a real pain, to be honest. I have divided the optimizations into 2 categories. The first one was to fix all Pro Tools issues with my meter, and the second one was general optimizations.
Let’s first start with the Pro Tools:
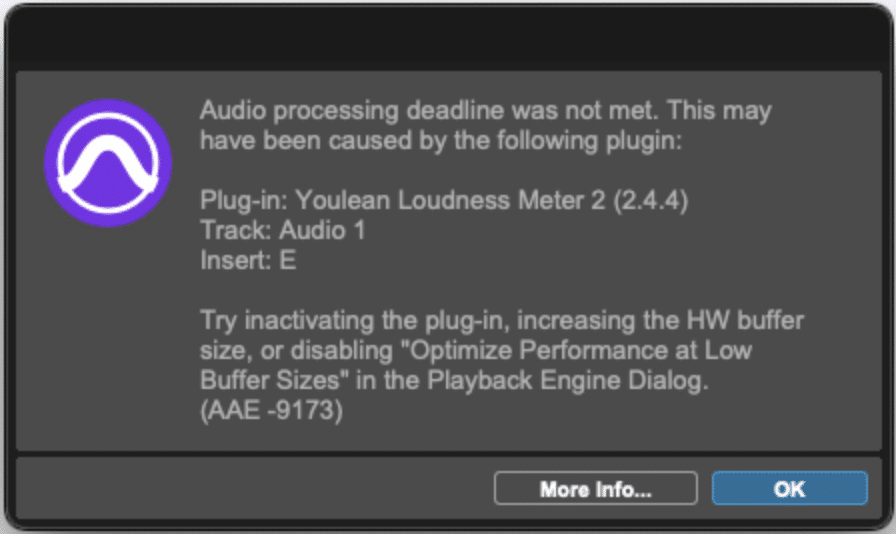
Some of you might have seen this error in Pro Tools. This error will occur if the plugin processing exceeds the audio buffer size. If you set the audio buffer size to 256 and you are using a 48000Hz sample rate, the audio processing should take 256/48000=0.00533 sec, or 5.3ms max.
To translate, you have 5.3ms to process 256 samples with all plugins. This was a bit strange, as YLM was way below this time on average, but it is still triggering the error.
Then I took a deep dive into the DSP performance. I loaded the Bitwig performance monitor. BTW, kudos to them as this monitor tool is super useful.
First using 256/44100Hz on my M1 Max didn’t show any significant problem. My deadline was 5.8ms and my plugin was causing max 0.45ms. This is well below the threshold.

However, when I switched to a 96000Hz sample rate, I immediately know that this ain’t good. The only question is how bad it is…

As you can see, we are much closer to the deadline here, and this is bad for multiple reasons. First, you shouldn’t have spikes in the processing like that if possible, and the second one is that I am using one of the fastest CPUs in the world, so the performance penalty will be much greater on slower devices. I was actually happy with this discovery as this meant that I finally get to fix that Pro Tools issue.
Now, the only question is why is this happening. I did some digging in the code and found the issue.
Have you heard of Murphy’s law before? If you have, you know what I will say. It was the absolute worst thing that is causing this. It was a combination of the Dolby Dialogue Intelligence algorithm and my code!
Dolby Dialogue Intelligence algorithm works internally at 16kHz sample rate and it needs a resampler in order to work properly with other sample rates. What was happening behind the hood was that the resampler was processing in larger chunks than the audio frame size and this created a problem with 88200Hz sample rates or bigger. The solution was simple, just resample in audio frame sizes, but the implementation and testing took months!
Fortunately, this was successfully implemented and tested and now the performance looks like this:

As you can see, now the 96000Hz sample rate performance looks even better than the 44100Hz performance with the V2.4.4!
So, now is all good with Pro Tools, right?
Wrong! 😡
We are still getting the same issue. To be honest, I was devastated that after months of work, I didn’t manage to fix the problem. Anyway, back to investigating.
I discovered 2 other issues. One was project saving speed and the other was working at 10h time code in Pro Tools.
After some digging and testing, the project saving was 10x faster and is now way below any threshold that can cause issues! Yey!
The second issue was a bit harder to fix. If you started the Pro Tools session at 10h the meter would fill 10h of data with zeros and that would cause the performance drop. The solution was simple, just ignore the starting 10h of data, but the implementation was harder than I thought. It took me a month to fix that issue and iron out all bugs.
Finally, all Pro Tools issues were fixed! I hope I will never hear about these issues anymore! 😀
I took some time to optimize other aspects of the audio performance too, and now I can proudly say that drag and drop is significantly faster. The speed-up is up to 4x in some cases. Try it out and compare it to the older version.
More File Export Options
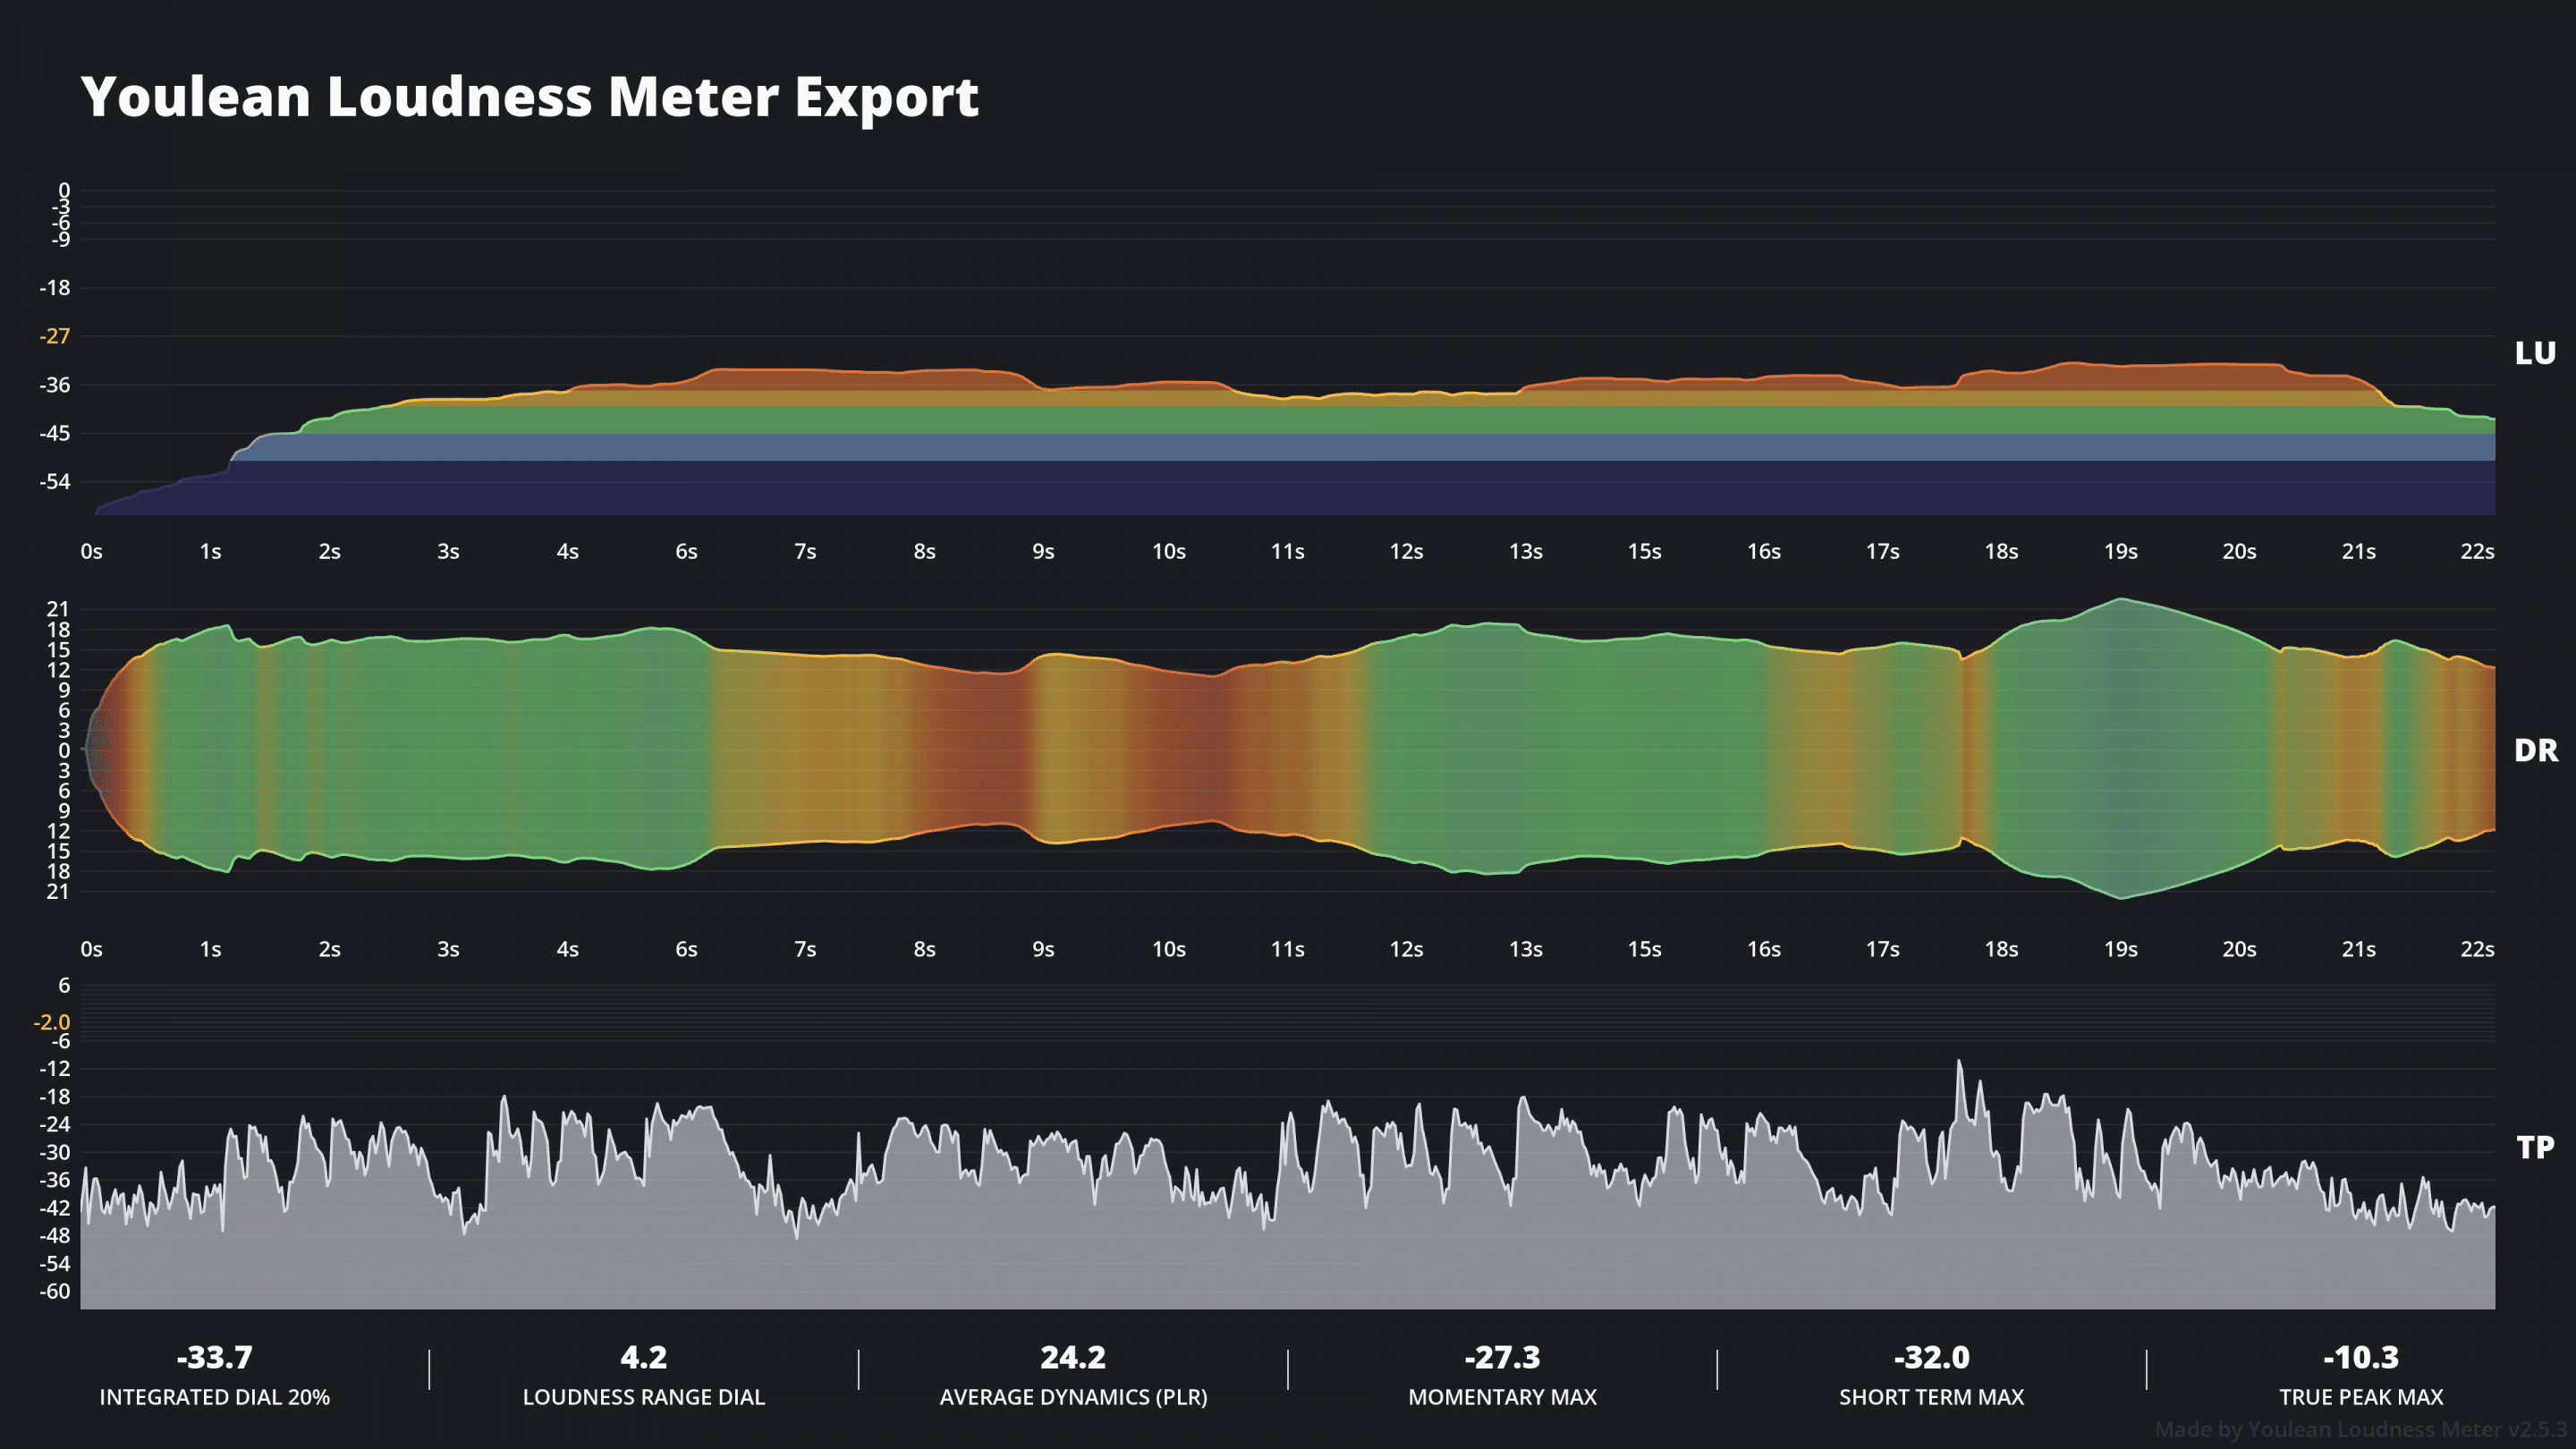
I have added a lot of new options for file export. You can now customize more picture exports, and I really like that you can now have loudness, dynamics and true peak graph on exported image at once.
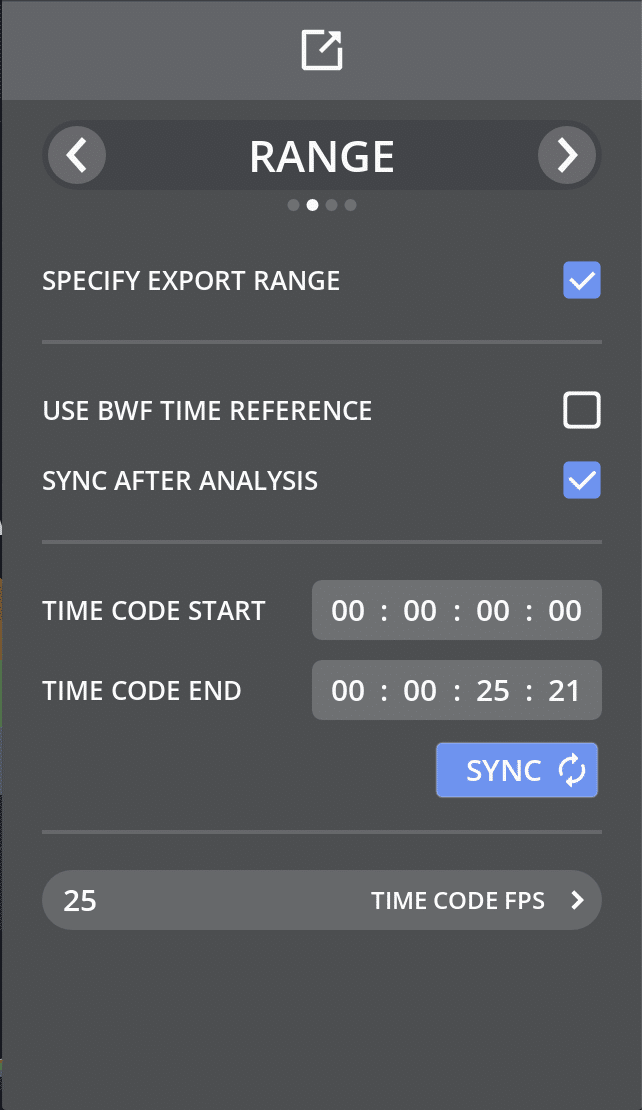
The new feature is that you can now specify the export range and that the BWF is now supported.
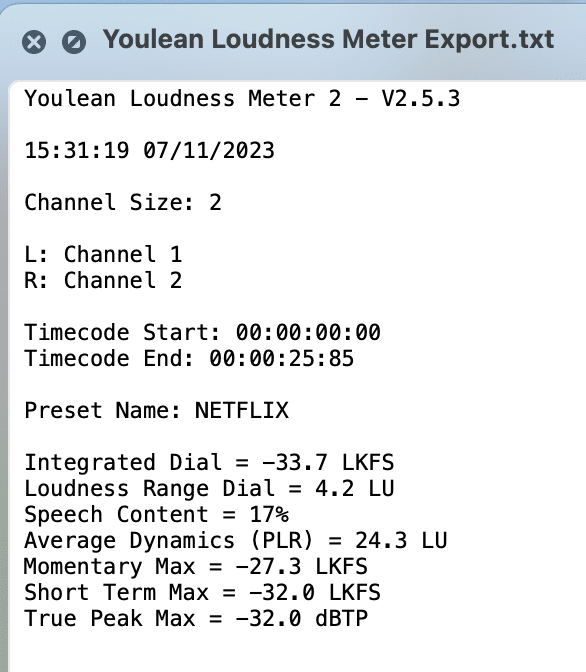
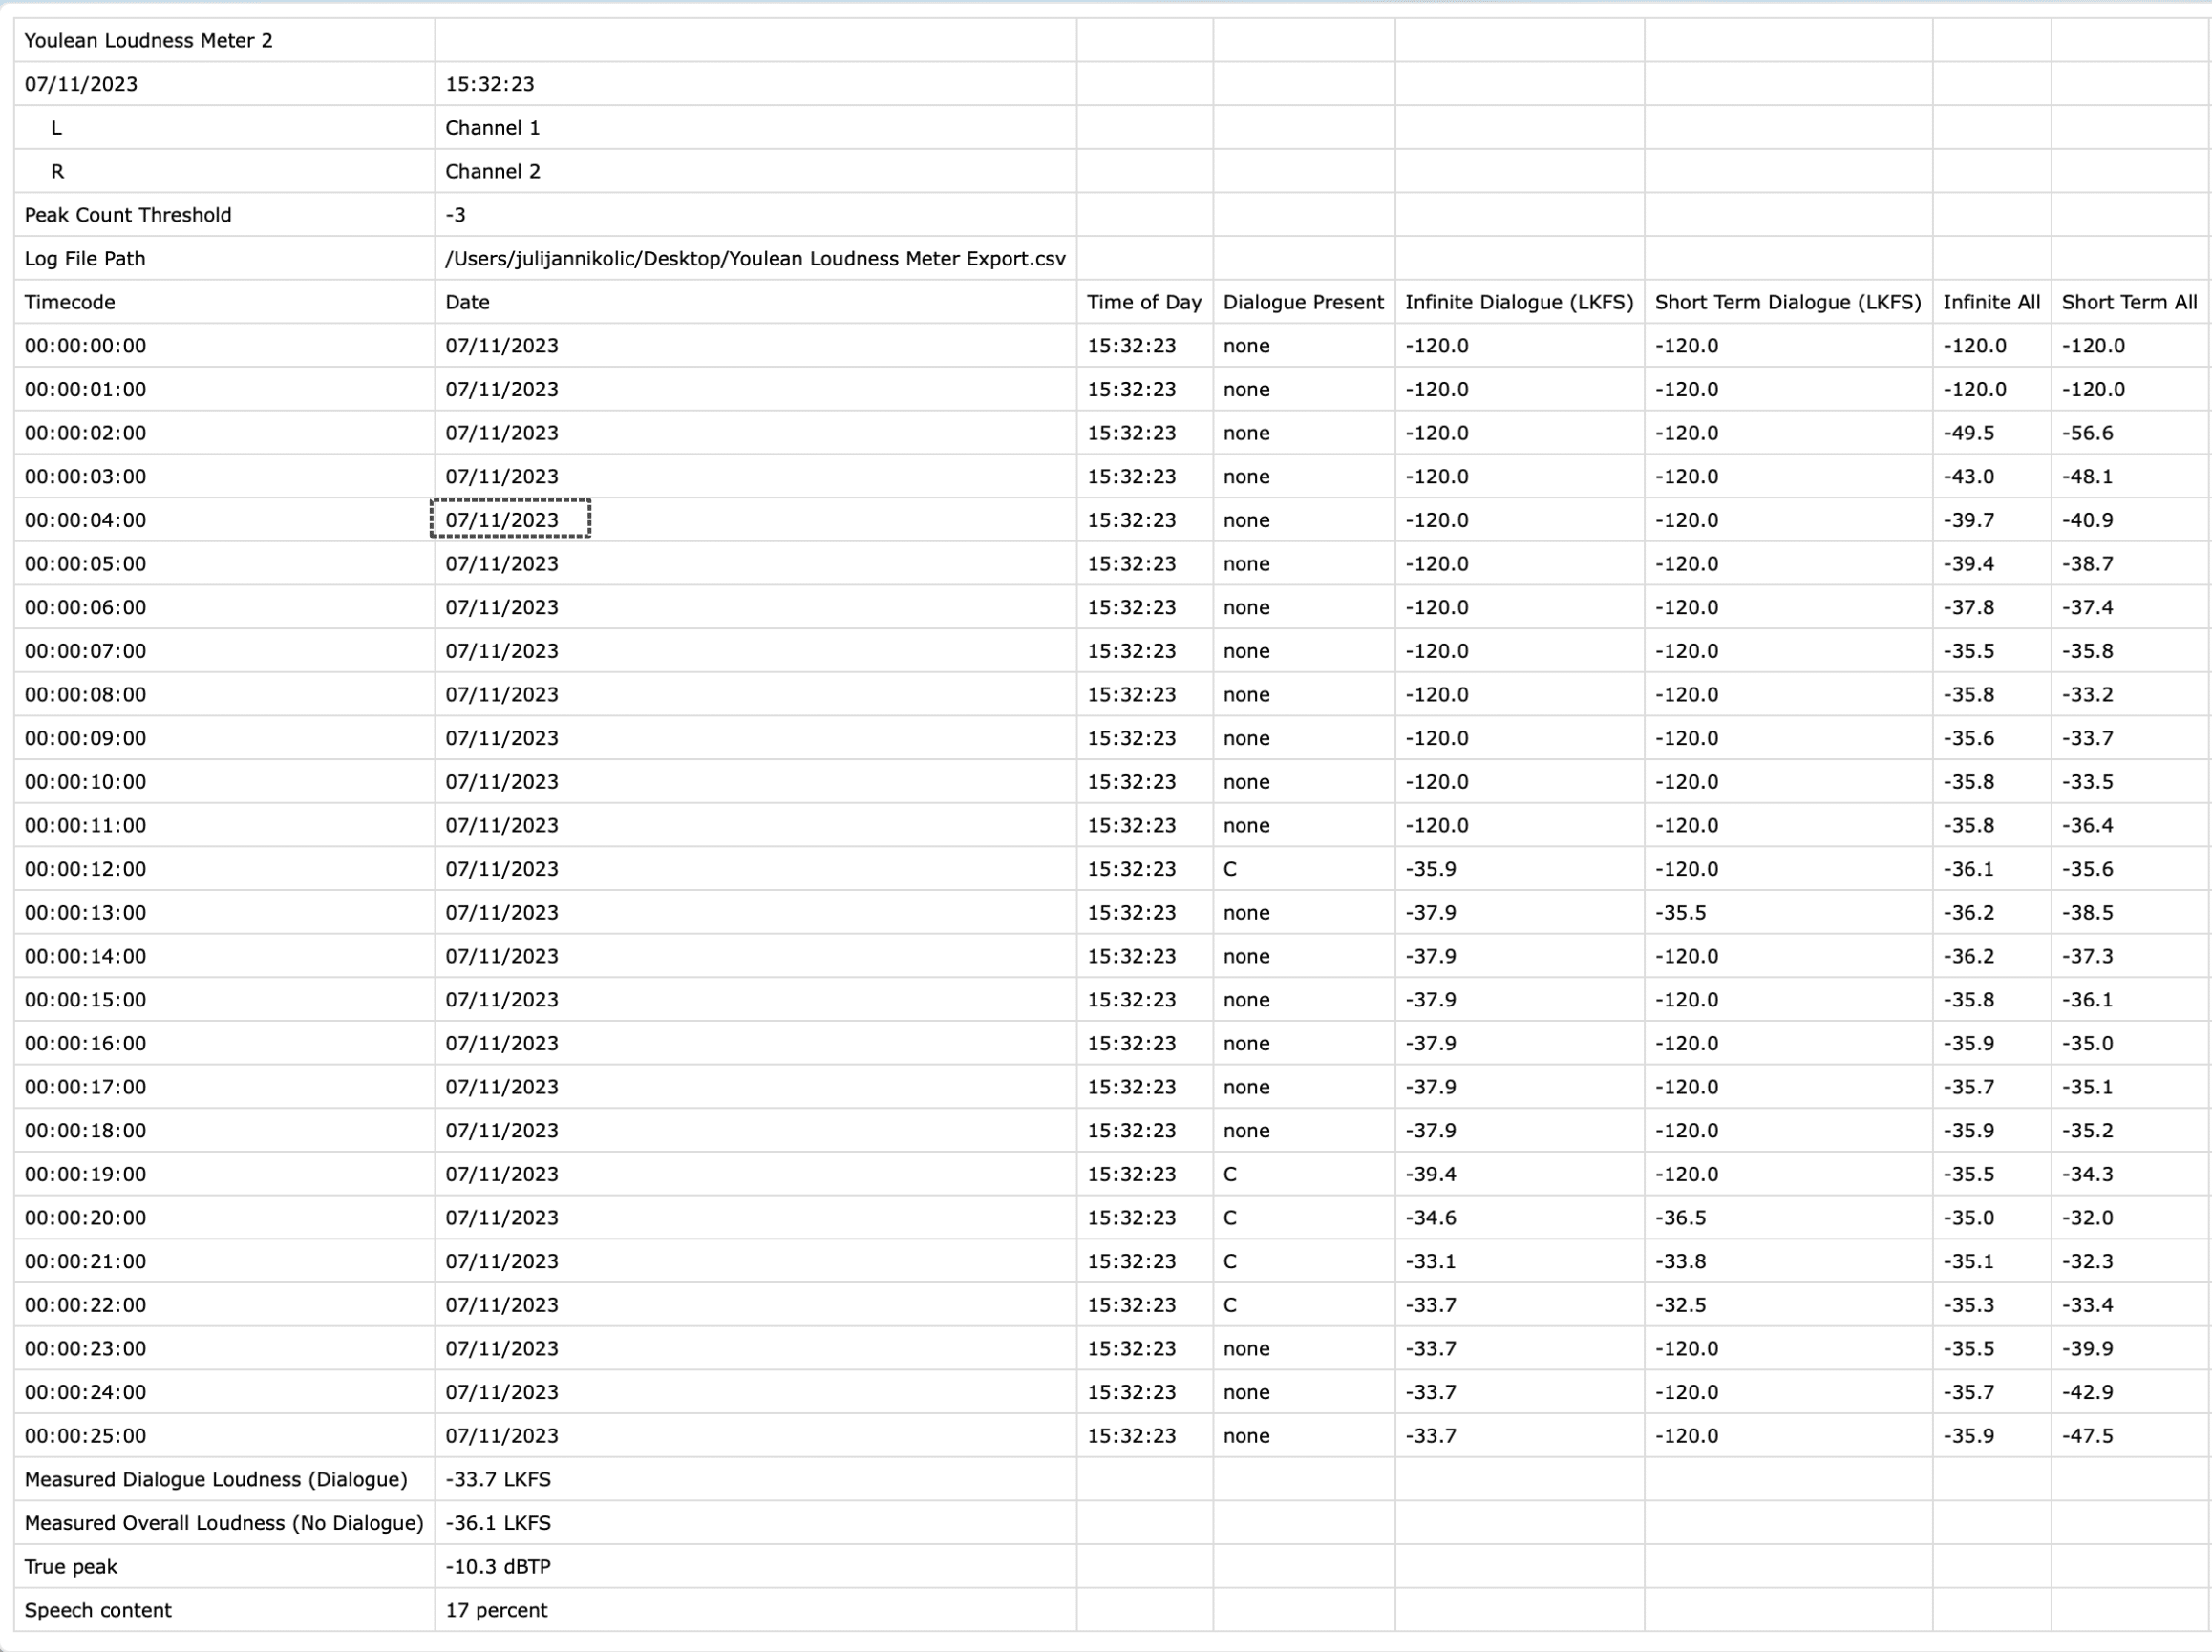
In terms of the new export file types, you can now export text summary files or Dolby CSV files which will produce the same report as Dolby Media Meter 2.
Text summary:
Dolby CSV:
Recalculate Selection Techology
This one is a super exciting one. I got this idea a long time ago and was never able to start working on it, but since I took more time for this update I thought now it is the time!
The idea was – wouldn’t it be cool to be able to select a part of the graph and get all measurements for that part only?
I guess it is cool, but after trying to implement it, I discovered why no other meter has this feature. This was really hard to implement because as you might know, integrated loudness and loudness range are calculated over the whole measurement, and using only the section of the measurements proved to be difficult. This was a challenge, but not a match for the best metering software developer. 😀
Let me present the “Recalculate Selection Technology”!
Here is how it works. Press CTRL or COMMAND and click and drag to select the part of the graph you want to remeasure:
The best thing is that this won’t affect any current measurements! That means that you can inspect selections while simultaneously measuring audio in real time!
File Browse for Drag & Drop
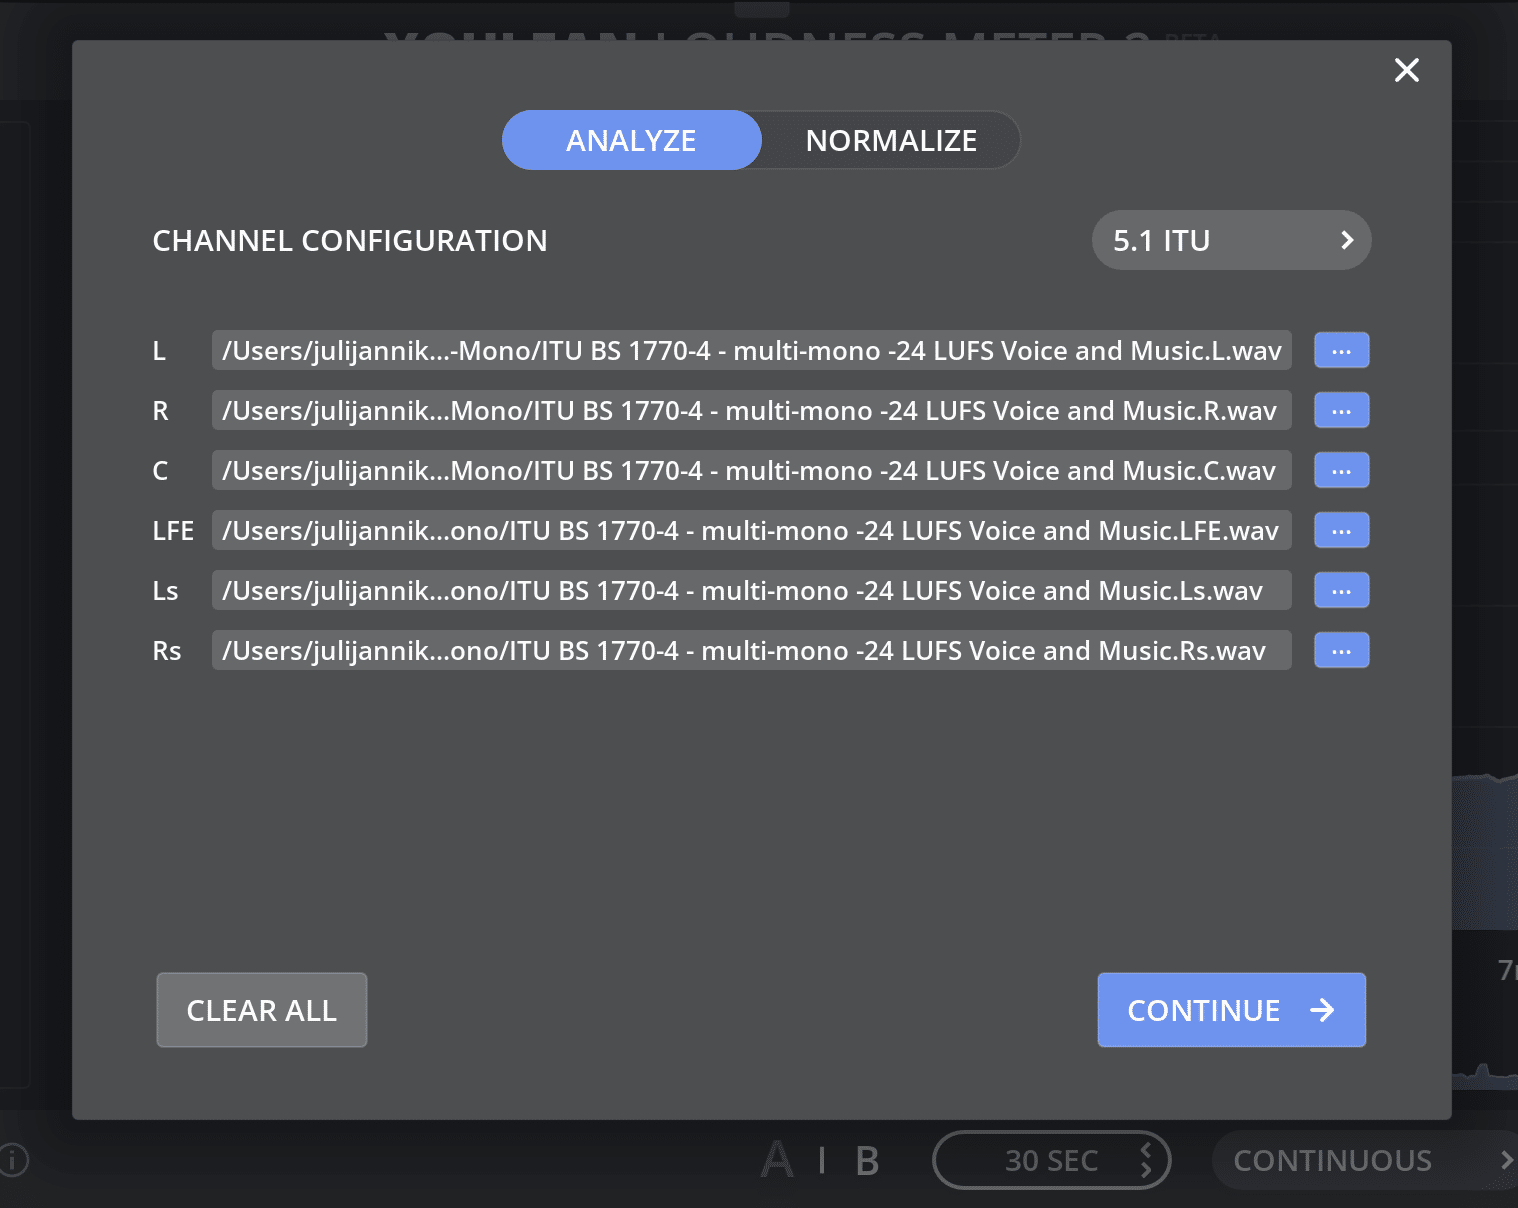
I have never liked how files are loading in YLM other than drag and drop, so I have created a new file browse panel.
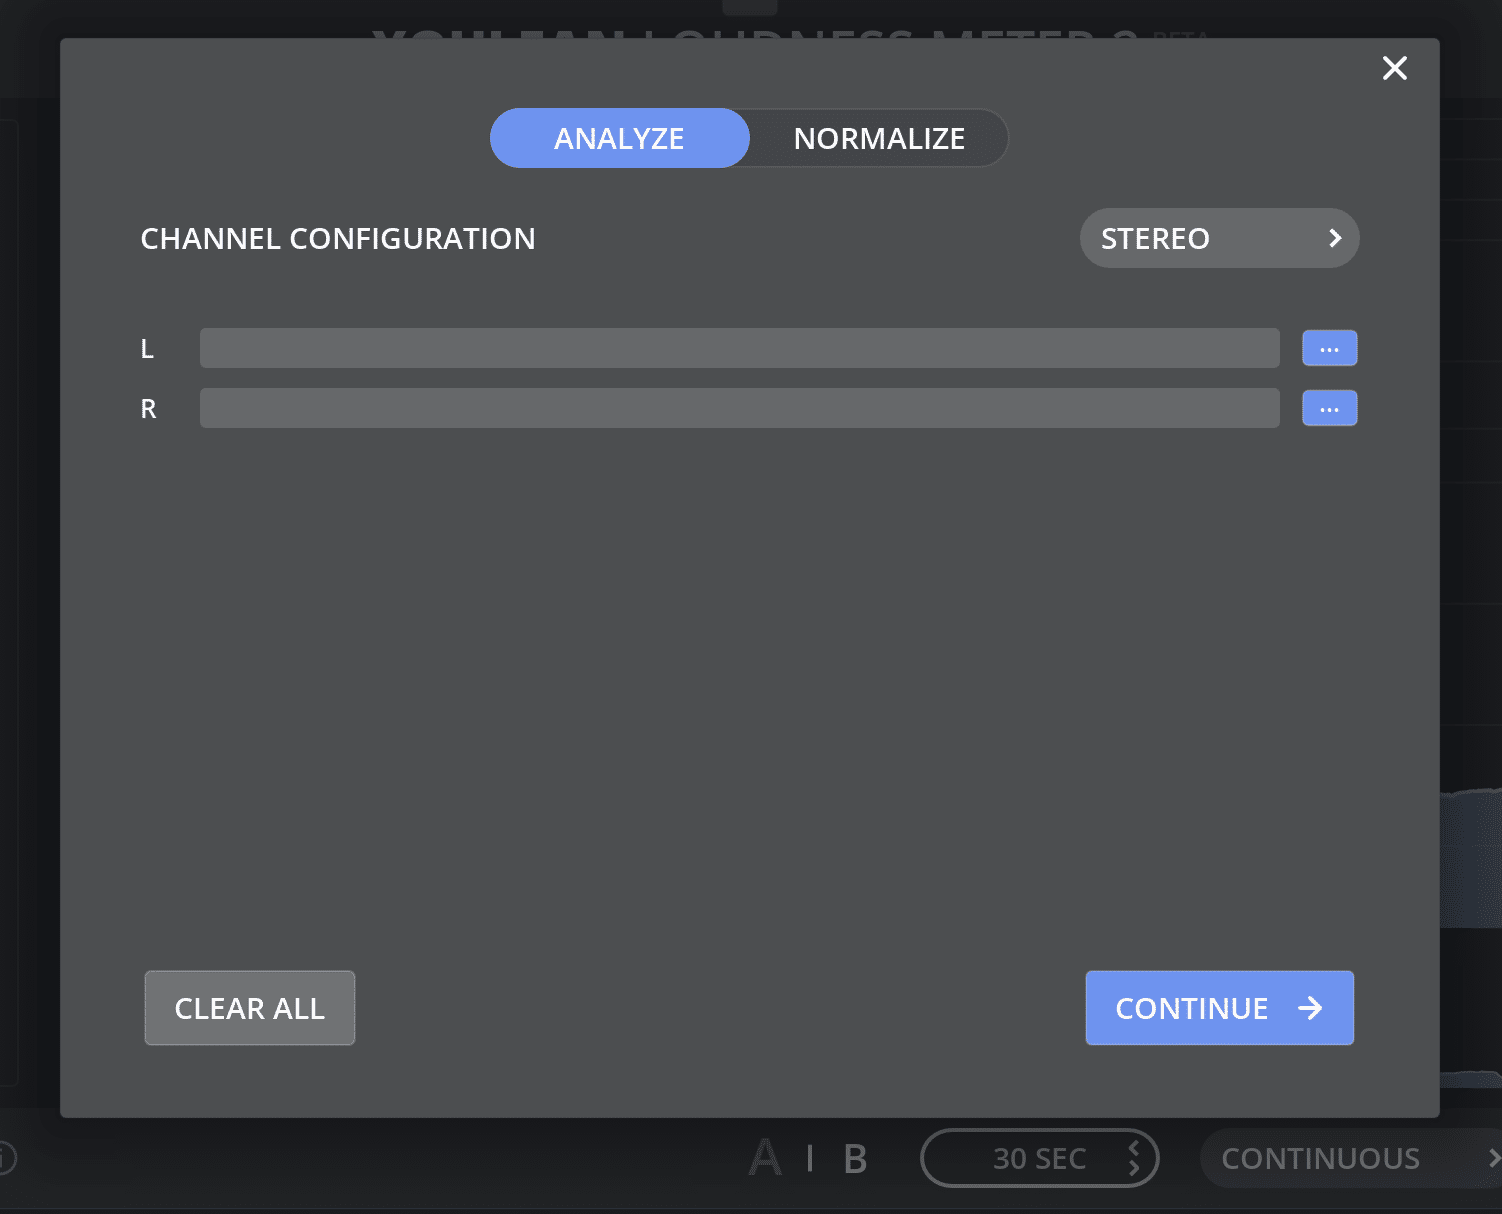
The advantage of this file browser is that you will always be sure what file was loaded for what channel. This will become super useful if you work with multi-mono audio files.
You can also drop a file on the interface to automatically populate it.
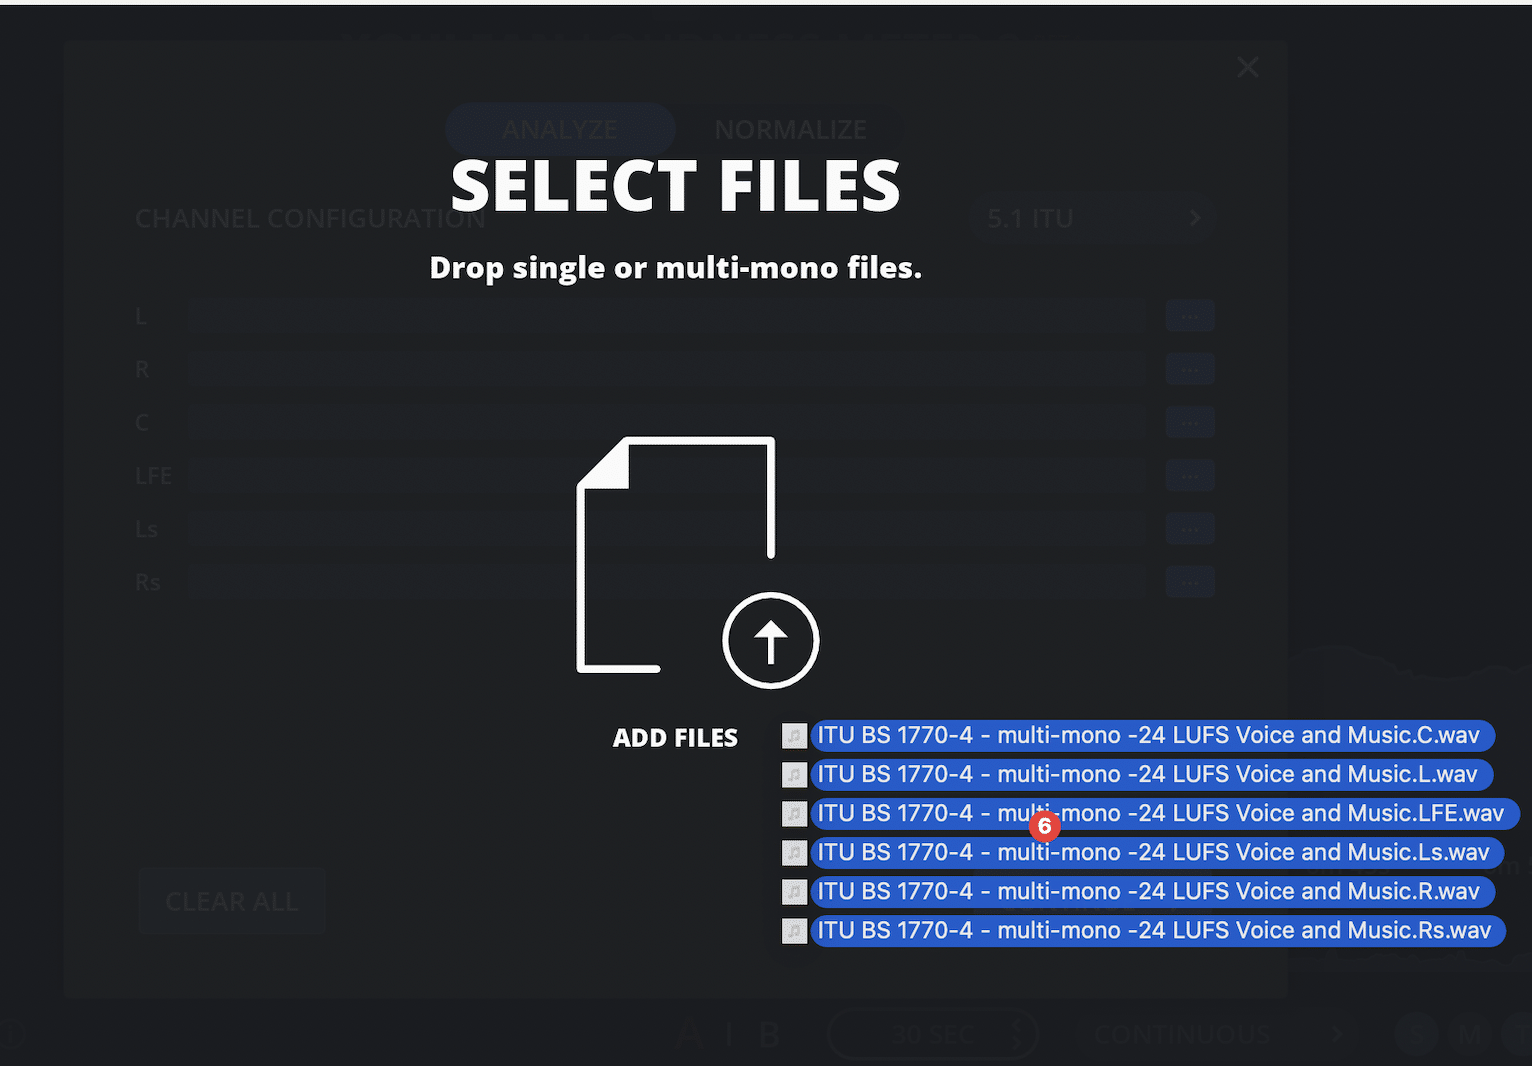
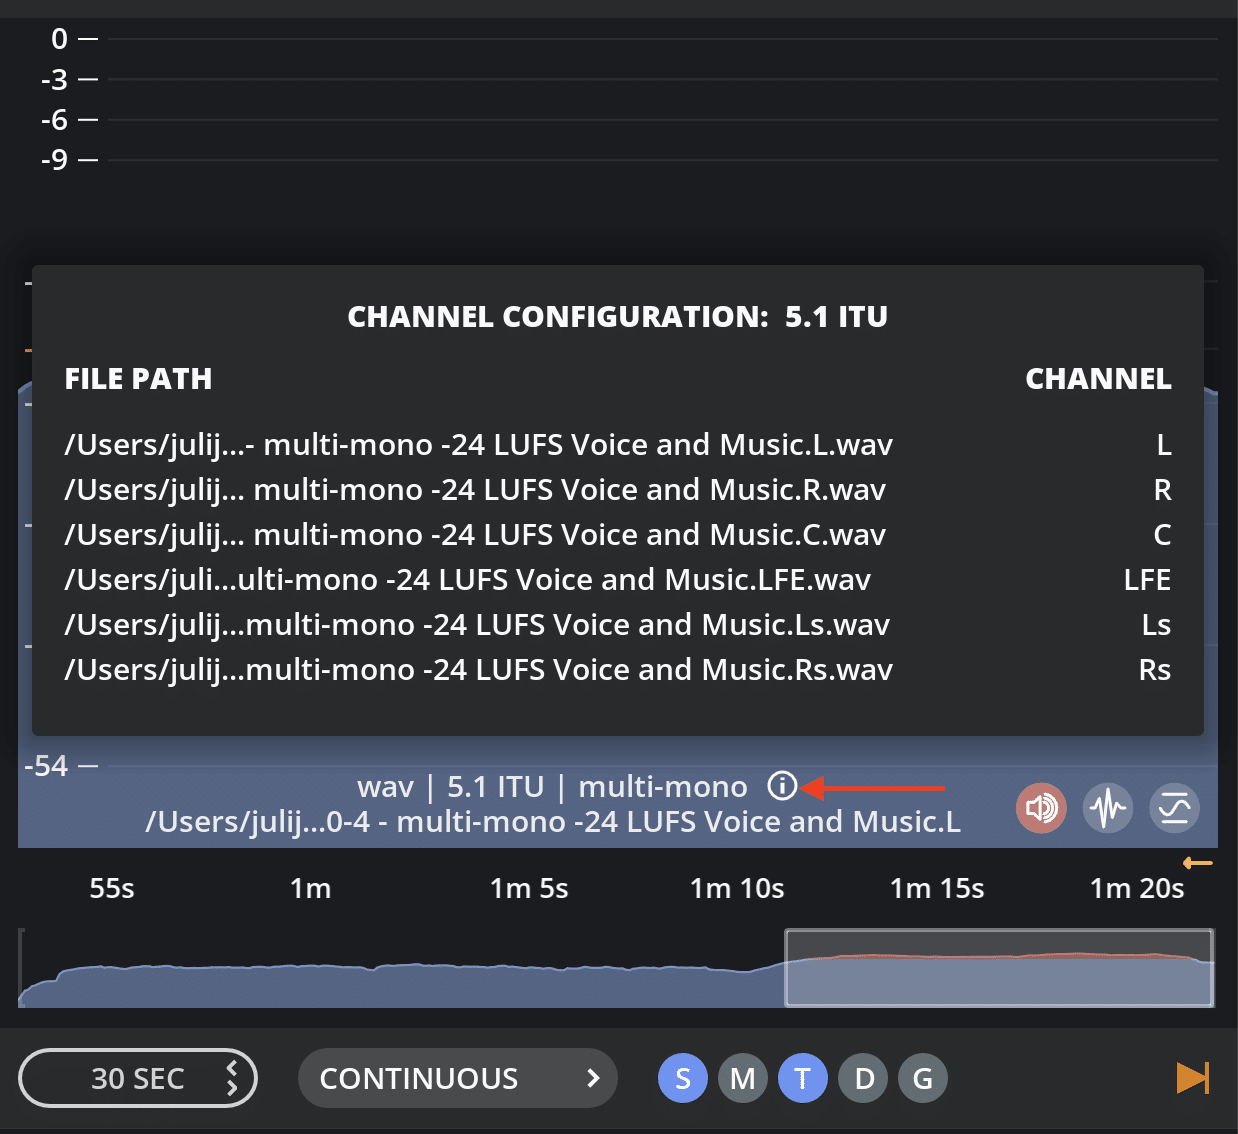
Once you finish the measurements, you can also verify the channel order by hovering mouse over this icon:
Use Drag & Drop to analyze FCPX clips directly
Wouldn’t it be cool to drop the FCPX clip to analyze it quickly? Now you can do that!
Command Line Tool
Uh, this one is also a long time on the to-do list. Fortunately, I was able to release the first version with this update. This option is for more advanced users so I don’t expect many to use it, but if you do, please let me know your thoughts.
I plan to improve it in the future, and I will need your feedback on that!
The command line tool will be good for automating tasks via scripts. You can analyze, normalize, or export measurement data.
If you have used the installer the command line tool will be installed automatically on macOS and on Windows if you enable add to PATH option in the installer.
The tool name is: “ylm2”
I have specifically chosen the short name in order not to collide it with the desktop app.
You should enter “ylm2 –help” in the terminal to see the usage examples and options.
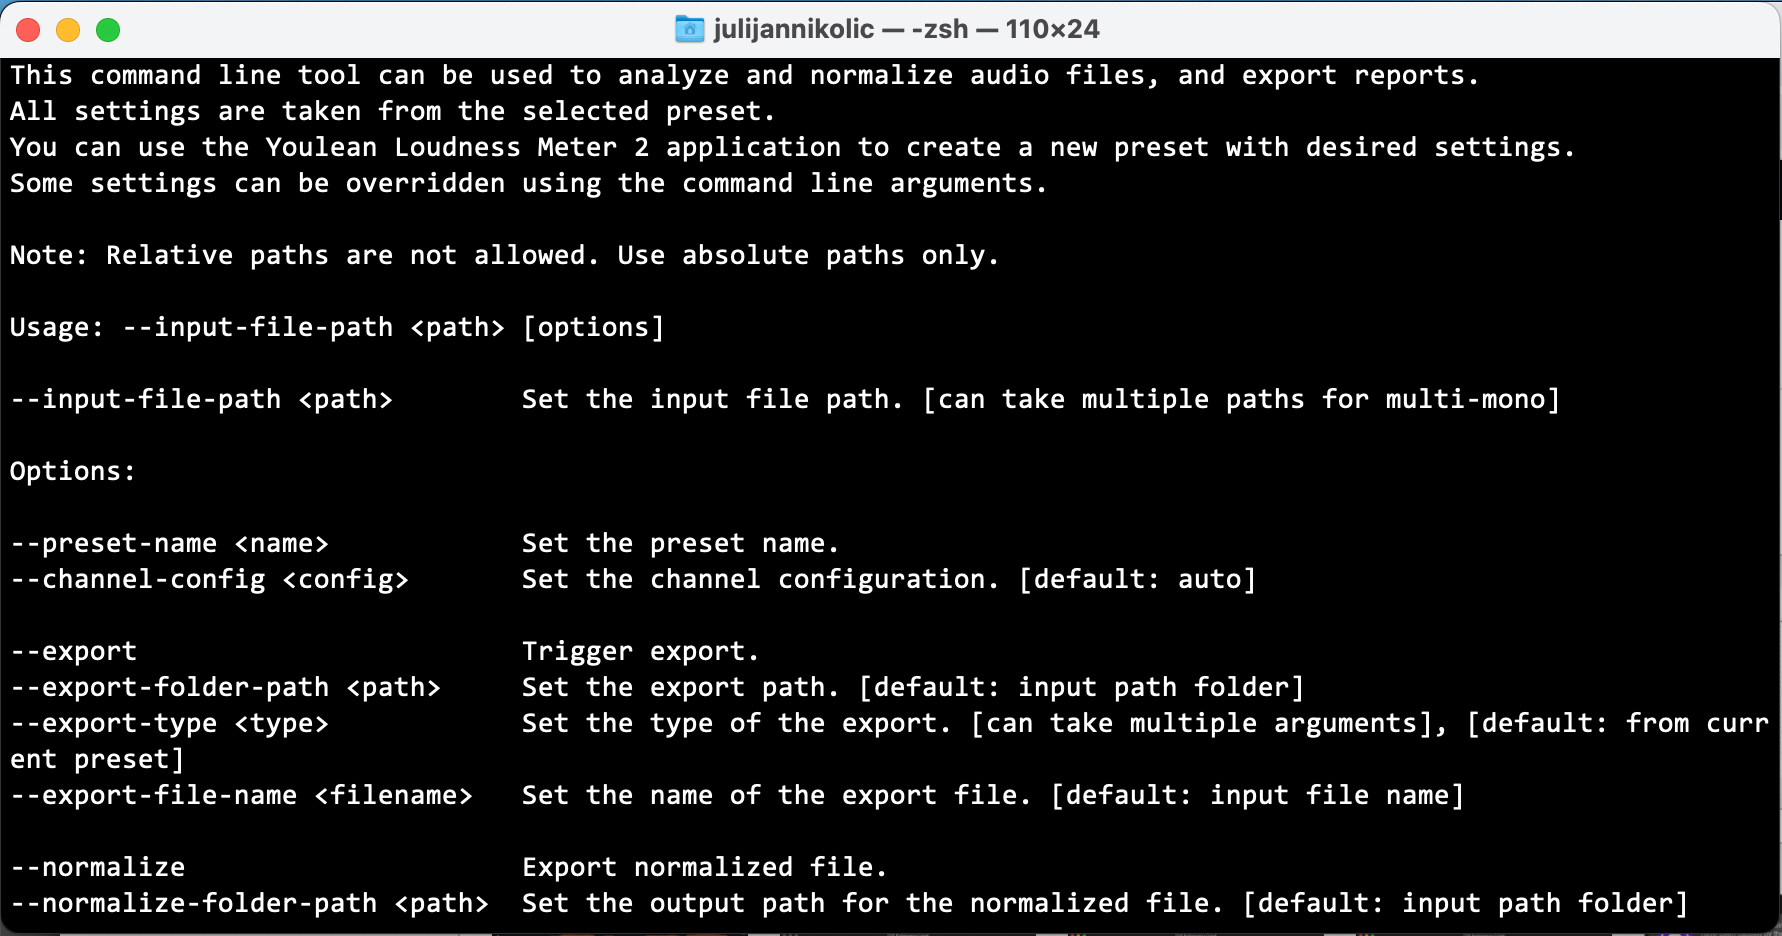
I am really excited to see what you will do with this new tool!
It should work on Windows Server if you install Windows Media Player, just keep in mind that you can not use this command line tool on the server for public use. Please read EULA for more details.
Lifetime Free Updates
As you can see, there are a lot of new features added in this update. Youlean Loudness Meter is slowly becoming another league of the meter and I am super proud of that! In the last couple of years, the biggest corporations in the world have recognized this meter and this makes me really happy. The corporations that I loved as a child now use my product. Can’t be better than that!
I know that you are enjoying your lifetime free updates. I know this because YLM is growing year over year, and this is the only right path to continue.
Enjoy metering and let me know what you think about this update!
Changelog:
- Added 3s and 5s windows sizes
- Added 8k and 16k image export resolutions
- Added a helper panel for showing drag and drop channel configuration
- Added ylm2 command line tool that can be used for analysis, normalization, and file export
- Added ability to analyze FCPX clips directly with drag and drop
- Added auto width expand export option
- Added Dolby Media Meter CSV export
- Added export range options with BWF metadata support
- Added file browse panel for selecting individual and multi-mono files
- Added more content options like drawing a true peak graph
- Added option to automatically export graphs after analysis
- Added option to bold loudness target line in the graph
- Added option to bold true peak max line in the graph
- Added option to disable drag and drop normalization
- Added option to disable finish animation after drag and drop
- Added option to disable or enable graph fill
- Added option to hide top and bottom bars on the interface
- Added option to import/export presets
- Added option to select a more dense scale, or streaming scale where -14 is always visible
- Added option to select graph sampling type. This will affect the graph’s appearance when you use a long zoom size.
- Added option to select monochrome, horizontal, or vertical graph coloring
- Added option to select the normalization file format
- Added option to show all measurements export option
- Added option to show color thresholds as a background below the graph
- Added option to show color thresholds numbering on scale
- Added option to use drag and drop folder path for export
- Added path stroke export options
- Added Recalculate Selection Technology. Select the part of the graph you want to recalculate
- Added system default option for app audio sample rate
- Added test files that can be used for analysis and normalization in free and PRO version
- Added text summary file export option
- Added true peak graph histogram view
- Apostrophes are now allowed in the export file name
- Auto reset will automatically be disabled if using time code mode
- File export will now exclude the start offset
- Fixed audio glitches when using low buffer size and high sample rate
- Fixed crash when switching the A/B states
- Fixed crash when trying to replace the exported file
- Fixed dialogue percentage not saved in graph export
- Fixed double click to enter a value not working for alerts when the relative scale is active
- Fixed drop-down menu not responding on macOS
- Fixed hang on load
- Fixed Pro Tools AudioSuite in some cases cuts measurements if previous measurements are not cleared manually
- Fixed Pro Tools crash when saving a session
- Fixed the “audio processing deadline was not met” problem when working at 10h timeline
- Fixed true peak alerts showing in the histogram graph if the true peak threshold is hit
- Fixed Windows crash with mp4 drag and drop
- Fixed Windows installer always adds a desktop icon
- GUI drawing is 2x faster. When working in time code mode, speed up is even more significant
- Histogram position will not change if the playback is stopped and time code histogram mode is used
- Image export timeline will switch to time code if using time code histogram mode
- Improved start-up speed
- Input gain correction is now app setting only
- Lowered brightness of “Created with Youlean Loudness Meter” on export pictures
- Normalization now supports input files greater than 4 hours in length
- Optimized drag and drop and increased speed by up to 3.7x times
- Plugin loading is now 34% faster
- Project saving is now 10x faster.
- Removed 32-bit AAX plugin support for Windows
- Removed graph reset when switching the histogram mode
- The audio driver is now disabled by default for standalone APP
- The dynamics color “knob” improved the handling of the mouse clicks
- The dynamics color button will now be displayed with the gradients like in the graph
- The meter will now smartly exclude all data at the start of the time code if necessary
- Updated targets UX
- You can now click on the “PAUSED” text to resume measurements
- Added ATSC A/85 DIAL preset

What a fantastic update, many thanks for making an already brilliant app ever better! This is definitely a must-buy plugin. Cheers!
Thank you so much!
Holy smokes, that’s a lot of new features! 🤯 Thanks for all the hard work. It’s much appreciated.
Indeed it is! 😁 Enjoy lifetime free updates!
This is super exciting! I was thinking only yesterday how you were going with the update and now we have access to it. Amazing!! It’s indispensable in my workflow.
And thank you for also taking the time to write such an in-depth post about your journey. It was certainly enlightening and humerous!
Thanks again to the “best metering software developer.”
Hahaha, that you too for reading all of this. It took me some time to write it all down. 😁
The vast majority of people do not realize just how incredibly hard it is to create and tweak software. I am grateful for this tool and the hard work you put in. Even with the small size of your operation, you are destroying much much much bigger operations. I also appreciated the extra commentary on your problem-solving.
Thanks! YLM has indeed become really complicated peace of software with a lot of unique features. Some decisions in the past are hunting me down, but isn’t that the case with software development in general… 😁
Amazing! I love the Loudness Meter already, but love seeing these improvements. I can honestly say it’s the one plugin I use in every session without fail. Keep up the fantastic work!
Thanks! I love seeing improvements too. Comparing original V2.0.0 and V2.5.3, is like comparing Prius and Tesla. 😂
Thanks for making this invaluable tool even better! Appreciate the incredible work you put into it.
Thanks! Have 200+ ideas on my todo list to make it even better. 😉
Hi,
2.5.3 is crashing Studio One Pro (latest version) on macOS 12.6.7. This is for the VST3 version.
2.4.4 VST3 version is working fine.
Projects won’t open if the plug-in is used anywhere. Studio One instantly crashes when it tries to open the Project.
Thanks. I will check what is going on.
I’m currently test 2.5.3 with the current beta version of Studio One 6 (6.2.1.94896). I have not had a crash with the couple of test that I’ have performed.
I use your fantastic software every day and on every production. Thank you for the great tool, your hard work and the engagement to improve it even more!
Awesome to hear that!
Thanks! 😉
absolutely amzing update. I downloaded it right away to try it out.
However, when I try to change the name before extracting the analyzed files, it immediately shuts down.
Am I the only one experiencing this? I would appreciate it if you could check.
I wish to use this beta version as soon as possible. 🙏
I will check what is going on!
Awesome tool. Can’t do without ever since. Accurate and thank you for making it available for free.
Cheers.
Thanks you so much! 😉
Excellent read as always in this blog. That’s not to mention the excellent added features to an already incredible plug-in. And it’s not just the features that I personally appreciate the most really, but the fact that this piece of software is so well-coded it tends to eat less and less CPU over each updated version – the opposite to what most other devs are doing! Youlean you’re a genius!
Hahaha, thanks Morfi! 😉
I was just wondering, are there any plans in the future to extend the Loudness Meter with thinks like a Goniometer, Bandpass RTA like TC-Electronic or RTW hardware?
Then I would replace my hardware analyzer immediately 🙂 Even if I would have to pay an upgrade price for it it would be worth it.
There is a plan for that, but we will see what will get implemented. 😉
Hey, great update. Love it!
One thing to suggest though: with the peak meter, you should limit the channel count shown according to the current channel configuration. For example, when Stereo configuration is selected for readouts, it should only have two channel on the meter. At the moment it shows 10 channels, but only two are metering. This is wasted space on the UI in my opinion.
When I select a new configuration, then it should show the corresponding amount of channels
Also, maybe i’m mistaken but the options for the peak meter are not doing anything. (bold target / graph fill / coloured background)
Otherwise, everything else is perfect for me.
Thanks again!
Sam
The peak meters will be improved in the future update. This is the top requested improvement with this update. 🙂
These settings will affect the true peak graph.
hi
first thank you for your amazing work…..
i’ve a applescript for put cue to -23 lufs with audio suite in protools.
but i can’t received the value directly in the plug window.
i export them in text and do the job.
it’s possible to get the value directly in the plug or it’s hard wok???
or can you put one option to export text automatically
after analyze in the audio suite .
hope to be clair….sorry for perfect english 🙂
best for france.
jf
Thanks!
Not sure how I would output the value from audio suite.
Can’t you try using the ylm command line tool instead?
thanx for answer.
the idea is to export automatic the cvs (or other) after the analysis of the audio suite button.
nugen have this option.
after analyst you can find a cvs with lufs info of the selected cube in protools.
i’ve tried with the terminal command but not working.
ylm2 path to wav
i’ve try with lot of combinaison but nothing .
the command line is installed
(/usr/local/bin/ylm2)
best and thx in advance.
jf
This can’t be done automatically for audio suite, but it can for drag and drop.
I think I have found a bug. I have two 2-hour long audio files as WAV and as AIFF (7.1 Dolby2) 24-bit 48khz. When analysing the AIFF version, only 20 seconds of the file are analysed and then stopped.
Please contact me here so we can investigate what is going on: https://youlean.co/contact/
What and amazing upgrade! I cannot wait to try out these new features with the Multi-Band Momentary analysis that I’m doing.
Awesome! Enjoy!
Recalculate Selection Techology is amazing. I’ve been wanting a form of this for the past couple of months for my current project which consist of a 6-1/2 hour timeline that contains 92 individual songs that I’m analyzing.
My analysis is single frequency band and multi-band, ie.
Subs: 20hz – 60hz
Lows: 60hz – 240hz
Low-Mids: 240hz – 2000hz
High-Mids: 2000hz – 8000hz
Highs: 8000hz – 20,000hz
Awesome, thanks!
Worthwhile improvements, and fascinating to see the depth and dedication of your work in ironing out those “fiendishly hidden” bugs. I will now go and check out the commandline tool. Salute & Namaste !
Thanks!
Thank you for your beautiful work! One bug…There is no more Custom logo printed in exported PDF/PNG…
Thanks. I will check that bug.
Great work!
Any plans on when this will be released officially (not as beta)?
Thanks
Releasing this as an official update is currently a top priority, but can’t tell you when will this happen.
v2.5.4 is causing Studio One v6.5.0 build 95450 to crash on Save.
Thanks for the bug report. I will check what is going on.
You are amazing. The plugin is so helpful and your tendency to share your coding and reasoning is brilliant. Maybe you would consider talking to my Student AES chapter at Berklee via zoom sometime?
best
Daniel
Thank you so much.
Sure, when I get some free time!
Did v2.5.4 fix the Studio One 6 crash issue?
The V2.5.5 should fix that issue!
Great product, great update! How to use ylm2 command line tool as Automator Quick Action on mac?
Thanks! You will need to run shell script for that.
Here are the examples how to use the ylm2 command line tool:
Examples:
1. Analyze file and print results: –input-file-path “/file/path/file.wav”
2. Analyze file and export png: –input-file-path “/file/path/file.wav” –export –export-type “PNG”
3. Analyze file and export png and print summary: –input-file-path “/file/path/file.wav” –export-type “PNG” –export –print-result
4. Analyze file and export pdf: –input-file-path “/file/path/file.wav” –export –export-type “PDF”
5. Normalize file and export pdf: –input-file-path “/file/path/file.wav” –normalize –export –export-type “PDF”
Great work and improvements!! Trying right now the beta version. The export to custom folder doesnt work correctly. I cannot choose the folder I want and always links to desktop. It would be nice to export all the True Peak issues that happened on an analysed track. I can only see the MAX True Peak on all export options except on the csv…maybe an PDF document?.
Hm, it should work. I will check.
You can export PDF where you can see all true peak issues.
Sorry, is the beta version V2.5.3 a free version or is it the paid version? Thanks in advance to anyone who wants to respond. Good music everyone 🙂
This will be both free and PRO depending on your license.
Hello Julijan,
Still playing around with new update. It’s amazing.
So far only one question pops to my mind – what happens when the measurement exceeds the new “Max Analisys Time”? Will it auto reset? And could that be in such instance used as auto reset for the whole measurement without touching the application (user input)?
Much love!
Thank you so much!
This won’t auto reset measurements. It will be used for allocating RAM needed for all measurement. Technically, measurements longer than set there will be possible, but if you exceed that value you might hear a click because RAM will need to be reallocated and that might cause audio underrun.
Youlean 2.2.5.6 shows strange behaviour in Pro Tools 2023.6 : The histogramm display show different graphs everytime when playing back the beginning of the audio . Sometimes it’s showing the correct graph and sometimes not. In Youlean 2.2.4.4 everything is fine.
Please contact me using the contact form on website so we can investigate that.